SocNetV v3.5 Released
SocNetV v3.5 released! 🎉
We are excited to announce the release of SocNetV v3.5, the most feature-rich release in the project’s history!
This release introduces graph exploration filters, a new ego-centered radial layout, a complete node/edge attribute system, a live data table dock with inline editing, and structured CSV/JSON export and import — unlocking a full roundtrip workflow between SocNetV and external spreadsheet tools.
🔍 What’s New in SocNetV v3.5?
🔎 Graph Exploration Filters
A new set of non-destructive, snapshot/restore filters lets you focus on the parts of the network that matter:
- Focus on Node (Ego Network): hides all nodes except the selected node and its direct neighbors, and all non-incident edges. Available in the Filter menu and node right-click context menu.
- Focus on Selection: hides all nodes not in the current selection and all edges whose endpoints are not both selected (
Ctrl+X, Ctrl+S). - Restore All Nodes: restores all nodes hidden by any filter (ego network, selection, or centrality). Available in Filter menu and right-click context menu.
- Restore All Edges: re-enables all edges hidden by the weight filter (
Ctrl+E, Ctrl+R). - All node-visibility filters share a unified non-destructive snapshot/restore history stack — Restore All works across all filter types.
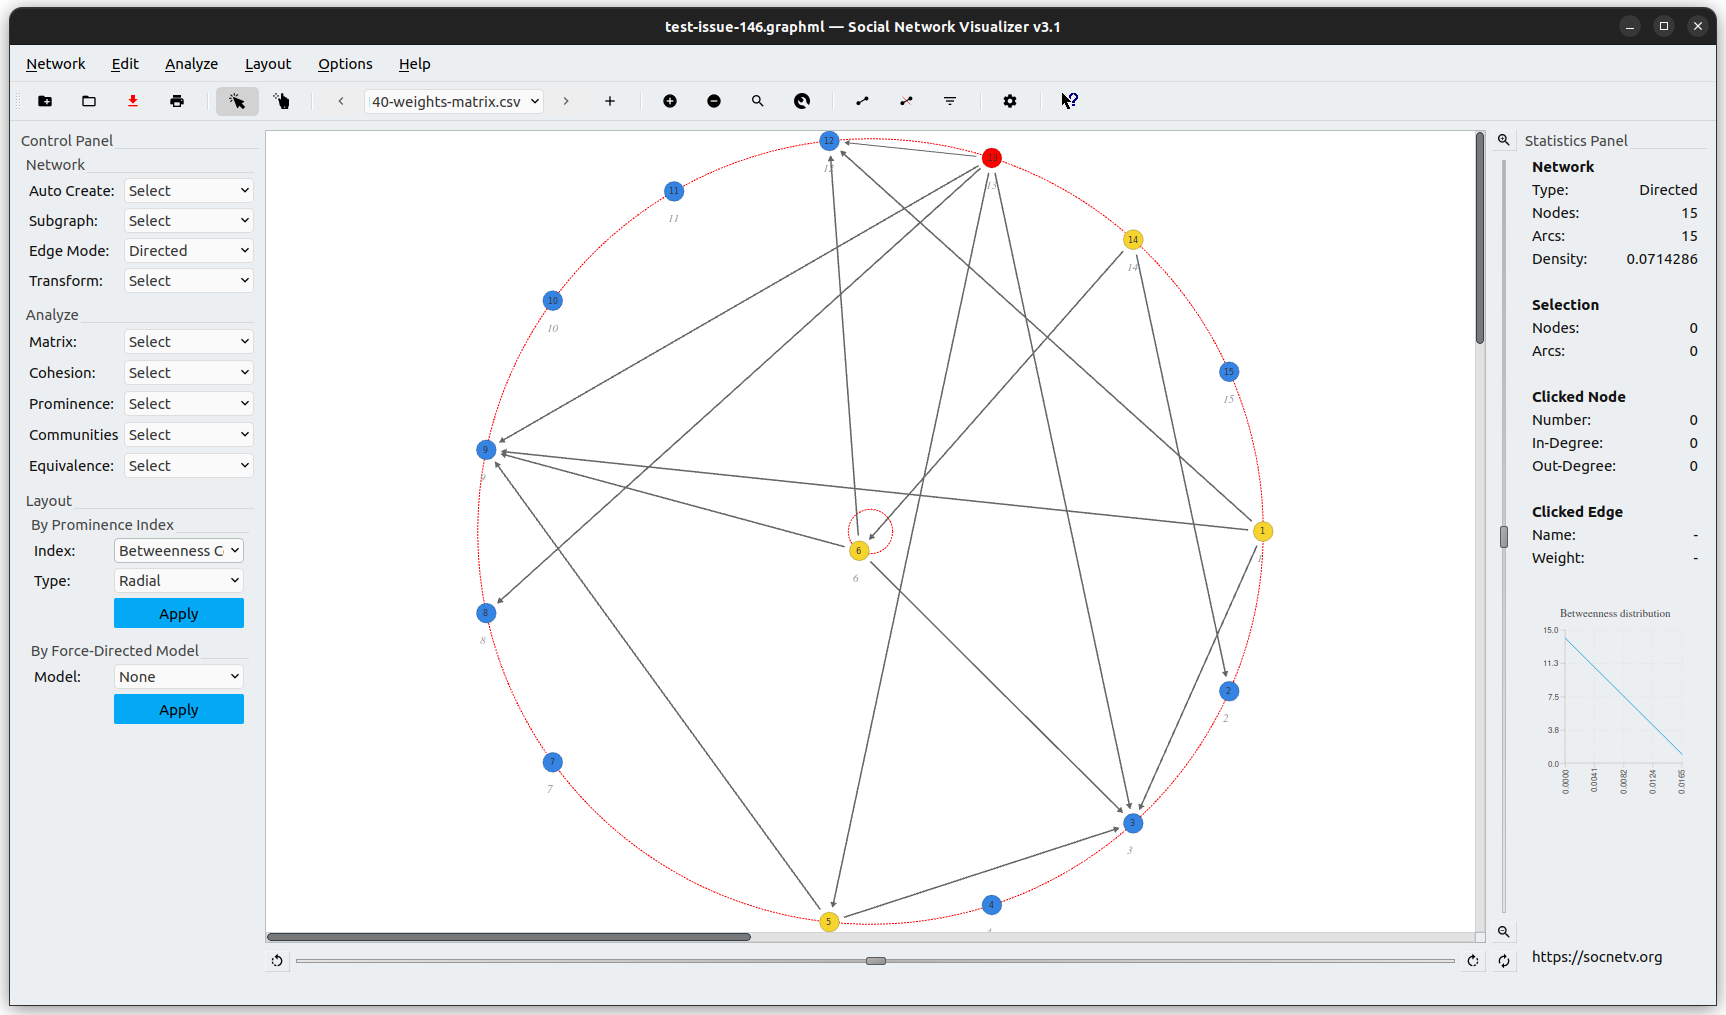
🌐 Ego-centered Radial Layout
A new layout places a selected node at the canvas center, its 1-hop out-neighbors on an inner ring, and all remaining nodes on an outer ring. Available via the Layout menu (Ctrl+Alt+E) and node right-click context menu.
🏷 Node/Edge Attribute System
SocNetV now supports arbitrary custom attributes on both nodes and edges:
- Set and remove custom key/value pairs on any node or edge via the Properties dialogs.
- Edge Properties dialog: edit label, weight, color, and arbitrary custom key/value pairs — accessible from the toolbar and edge right-click context menu.
- GraphML roundtrip: custom node and edge attributes are fully saved and reloaded when working with GraphML files.
- Filter Nodes By Attribute: a non-destructive filter available in the Filter menu (
Ctrl+X, Ctrl+A) lets you show only nodes matching a key/value condition.
⚙️ Attribute-based Filtering
- Filter conditions support scope (Nodes, Edges, or Both), key, operator (
=≠><≥≤contains), and value. - A dedicated dialog lets you select a scope, pick from existing attribute keys, choose an operator, and enter a value.
- Edges can also be filtered by attribute, using the same snapshot/restore stack as node filters. Numeric values are compared numerically; text values are compared lexicographically.
- A filter combo in the Control Panel and a dedicated toolbar filter group give one-click access to all filter actions.
🏷 Filter Bar with Chips
- A persistent Filter Bar strip sits between the toolbar and canvas; it is hidden when no filter is active and appears automatically when any filter is applied.
- Each active filter condition is shown as a labelled chip (e.g.
Nodes: ego network,Edges: weight filter,Nodes: type = investor). - Clicking × on the most recently applied chip removes it and reverts that one filter step.
- The “Clear all” button removes all active filters in one click.
- All five filter actions produce chips: centrality, ego network, selection, attribute, and edge weight.
📋 Node/Edge Data Table Dock
- A new dockable Data Table panel (
Ctrl+T, also in Options and Edit menus) with two tabs — Nodes and Edges. - Nodes tab: columns for number, label, visibility, shape, size, and color — plus one column per custom attribute key. Label, size, color, and custom attribute cells are inline-editable (double-click).
- Edges tab: columns for source, target, relation, weight, label, and color — plus custom attributes. Weight, label, color, and custom attribute cells are editable.
- All edits write back to the graph immediately.
- Live search bar filters all columns (case-insensitive); column headers are sortable; a Refresh button reloads data from the current graph.
- The panel auto-refreshes on file load and graph reset when it is open.
📤 Structured CSV/JSON Export
- Each tab in the Data Table dock has Export CSV and Export JSON buttons — they export the currently visible (search-filtered) rows.
Network → Export to other...gains four new actions: Nodes as CSV, Edges as CSV, Nodes as JSON, Edges as JSON — these always export all rows.
📥 Structured CSV/JSON Attribute Import
- Import node or edge attributes from a CSV or JSON file via the Import buttons in the Data Table dock.
- A preview dialog shows the first rows of the file and lets you map columns: choose which column holds the node ID (or the source/target for edges).
- Standard columns (
Label,Size,Colorfor nodes;Weight,Label,Colorfor edges) are routed to their proper fields; all other columns become custom attributes. - The table auto-refreshes after import.
- Supports a full lossless export→import roundtrip: re-importing an exported file produces no duplicate columns and no data loss.
📊 Spreadsheet-based Bulk Attribute Editing
Export the data table to CSV or JSON, edit it freely in any spreadsheet tool (Excel, LibreOffice, Google Sheets), and re-import to update attributes in bulk. Each node or edge can carry different values — unlike in-app bulk operations which assign one value to many.
⚡ Improvements
- Fruchterman-Reingold layout: significantly faster on large graphs thanks to pre-cached adjacency lookups, better initial placement, and early convergence detection.
- Kamada-Kawai layout: particles that drift out of bounds are now clamped to the canvas instead of being teleported randomly.
🐛 Bug Fixes
- Fixed Kamada-Kawai crash when node filters are active.
- Fixed crash on graph reset when an edge had already been removed.
- Fixed filter history stack not being cleared on graph clear / application reset.
- Fixed custom node attribute key/id mismatch in GraphML export.
- Fixed Pajek parser: use default node shape as fallback when no Pajek shape keyword is present.
- Fixed hierarchical clustering dialog signal/slot mismatch.
- Fixed Node Properties dialog UX issues for custom attributes.
- Fixed triad census appending stale zeros on repeated runs.
We’d like to thank our contributors and users for reporting issues, testing fixes, and helping SocNetV improve with every release. 🙏
Download SocNetV v3.5 from our Download page and let us know what you think!
Happy analyzing!
— The SocNetV Team