Data Management
SocNetV v3.5 introduces a complete data management layer: attach arbitrary key/value attributes to nodes and edges, inspect and edit them in a live table dock, export to CSV or JSON, and re-import from any spreadsheet tool — all without leaving SocNetV.
Node and Edge Custom Attributes
Beyond the built-in properties (label, size, color, shape for nodes; weight, label, color for edges), you can attach arbitrary custom key/value pairs to any node or edge. Custom attributes travel with the graph and are preserved when saving to GraphML format.
Node Custom Attributes
Open the Node Properties dialog (double-click a node, or right-click → Edit Node) to:
- View existing custom attributes in the attributes table.
- Add a new key/value pair.
- Edit or delete existing pairs.
Keys must be unique per node. Values are always stored as strings; numeric comparisons in the filter dialog convert them on the fly.
Edge Properties Dialog and Edge Custom Attributes
Right-click any edge on the canvas, or select an edge and click the Edge Properties toolbar button, to open the Edge Properties dialog. From there you can:
- Edit the edge label, weight, and color.
- Add, edit, or remove custom key/value attribute pairs for that edge.
Data Table Dock
The Data Table dock is a dockable panel that shows all nodes and edges of the current graph in a tabular view with inline editing, live search, and structured export/import.
Toggle: press Ctrl+D, or use Edit → Show Data Table / Options → Show Data Table.
The panel docks at the bottom of the main window and auto-refreshes whenever a file is loaded or the graph is reset (while the panel is open).
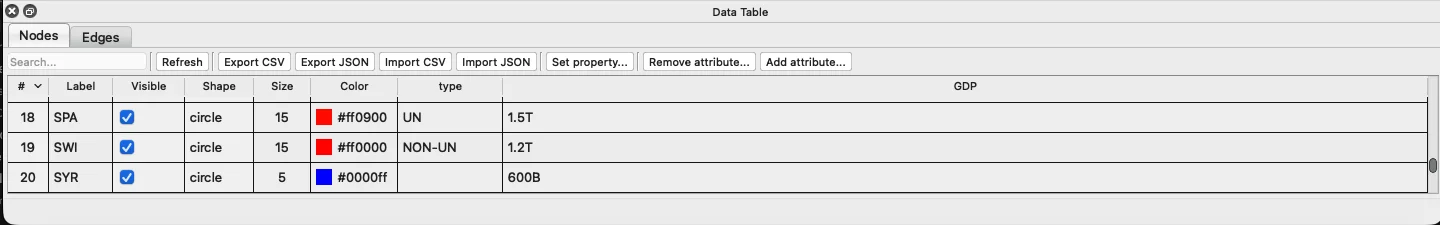
Nodes Tab
| Column | Editable | Notes |
|---|---|---|
| # | No (shaded) | Node number |
| Label | Yes | Double-click to edit inline |
| Visible | No (shaded) | Reflects current filter state |
| Shape | No (shaded) | |
| Size | Yes | |
| Color | Yes | Hex color string, e.g. #ff0000 |
| custom attribute keys | Yes | One dynamic column per key present in the graph |
All edits write back to the graph immediately.
Edges Tab
| Column | Editable | Notes |
|---|---|---|
| Source | No (shaded) | Source node number |
| Target | No (shaded) | Target node number |
| Relation | No (shaded) | Active relation name |
| Weight | Yes | |
| Label | Yes | |
| Color | Yes | Hex color string |
| custom attribute keys | Yes | One dynamic column per key present in the graph |
.webp)
Search, Sort, and Refresh
- Live search bar: type to filter all columns simultaneously (case-insensitive). Non-matching rows are hidden instantly; the graph itself is not affected.
- Column headers: click to sort ascending or descending.
- Refresh button: reload all data from the current graph state (useful after external changes).
Exporting Node/Edge Data as CSV or JSON
From the Data Table dock
Each tab has Export CSV and Export JSON buttons. They export the currently visible rows — rows hidden by the search filter are excluded. What you see is what you get.
From the Network menu
Network → Export to other… provides four actions that always export all rows, ignoring any active search filter:
- Nodes as CSV / Edges as CSV
- Nodes as JSON / Edges as JSON
The status bar shows the export file path on success.
File formats
CSV — RFC 4180 with a header row. Example:
#,Label,Size,Color,type,department1,Alice,8,#ff0000,investor,finance2,Bob,5,#0000ff,manager,operationsJSON — an array of objects, one object per node/edge:
[ { "#": 1, "Label": "Alice", "Size": 8, "Color": "#ff0000", "type": "investor" }, { "#": 2, "Label": "Bob", "Size": 5, "Color": "#0000ff", "type": "manager" }]Importing Attributes from CSV or JSON
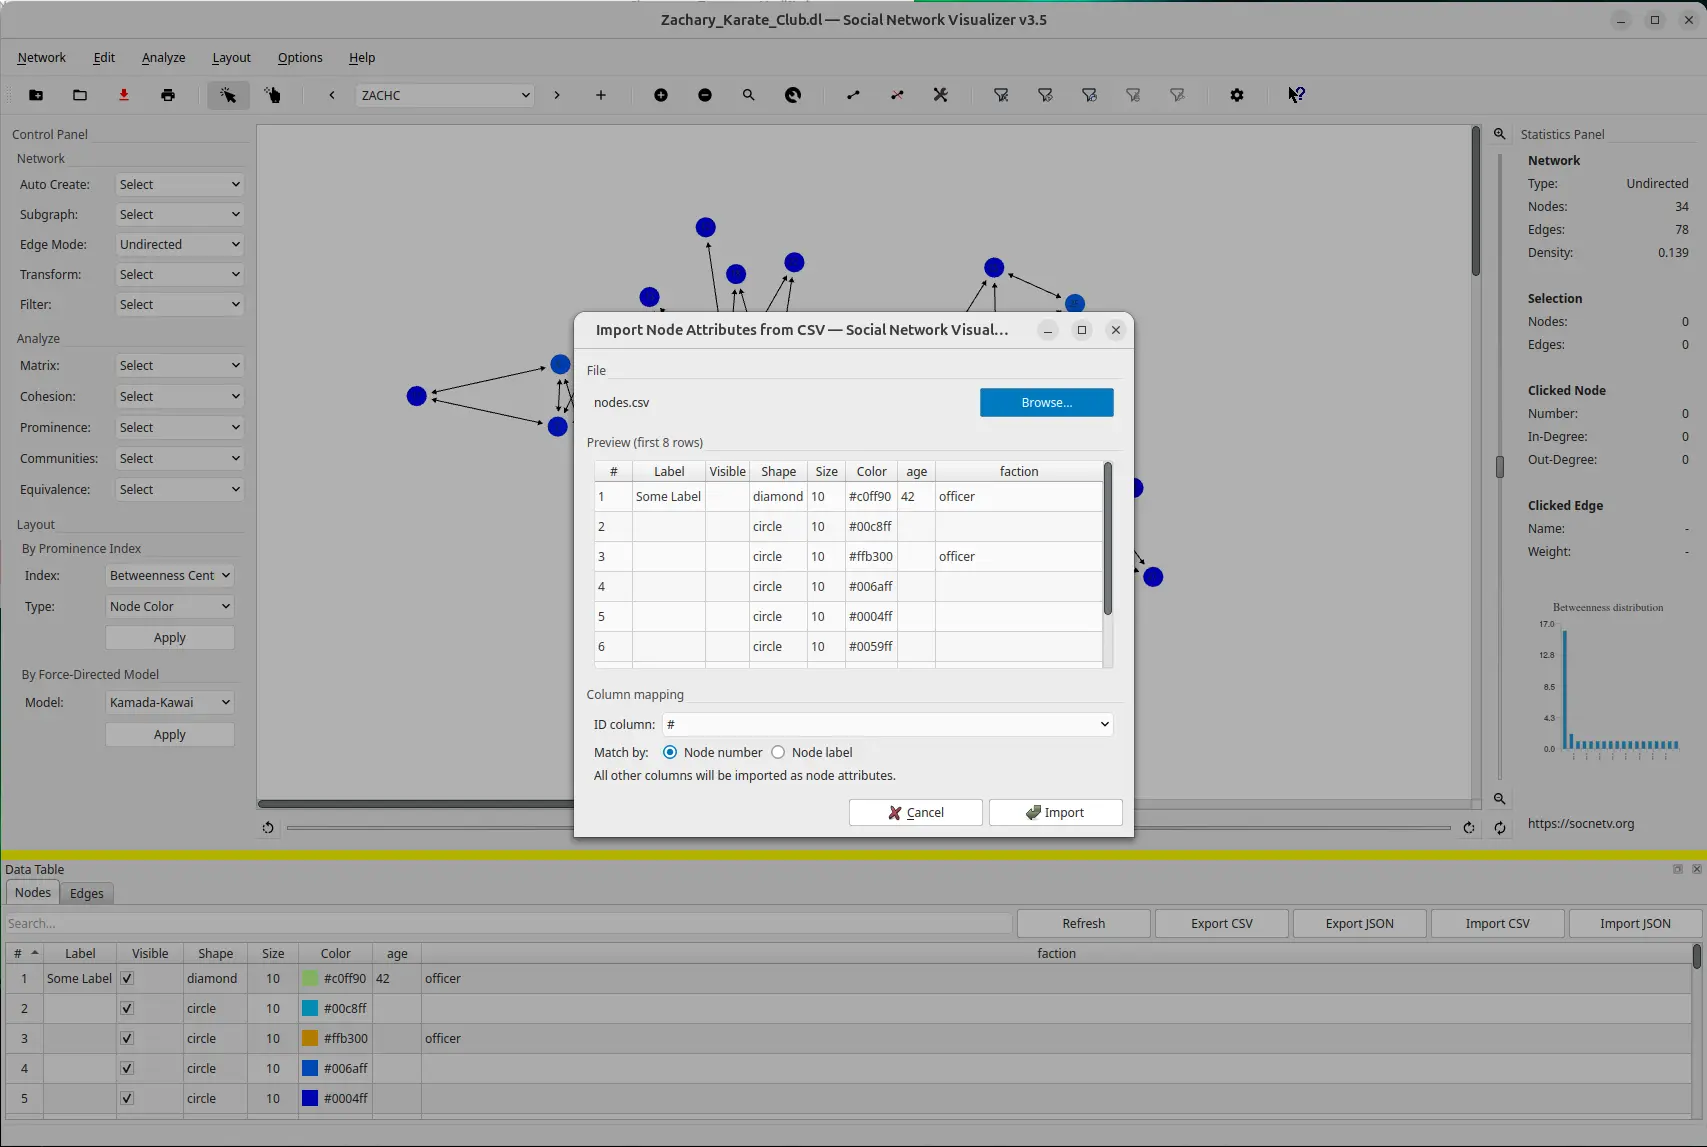
Each tab in the Data Table dock has Import CSV and Import JSON buttons.
Step-by-step
- Click Import CSV (or Import JSON) in the Nodes or Edges tab.
- Browse to your file. A preview of the first 8 rows appears so you can verify the content.
- Map columns:
- Nodes scope: choose the ID column (the column holding node numbers or labels) and set Match by to Node number or Node label.
- Edges scope: choose the Source and Target columns. Common names (
source,src,target,tgt,dest) are auto-detected and pre-selected.
- Click Import.
The table auto-refreshes and the status bar reports how many rows were matched.
Column routing rules
| Column name | Effect on import |
|---|---|
Label (nodes) | Updates node label |
Size (nodes) | Updates node size |
Color (nodes or edges) | Updates color |
Weight (edges) | Updates edge weight |
Label (edges) | Updates edge label |
Visible, Shape (nodes) | Read-only — silently skipped |
Relation (edges) | Read-only — silently skipped |
| Any other column | Added or updated as a custom attribute |
Columns absent from the import file leave existing values unchanged — the import is purely additive/overwriting for the columns it touches.
Spreadsheet-based Bulk Attribute Editing
Combining export and import enables a powerful external bulk-editing workflow using any spreadsheet application (Excel, LibreOffice Calc, Google Sheets, etc.).
Workflow
1. Open the Data Table dock (Ctrl+T)2. Switch to the Nodes or Edges tab3. Click Export CSV (or Export JSON)4. Open the file in your spreadsheet editor5. Edit values freely — each row can have different values6. Save the file (keep the same format)7. Click Import CSV (or Import JSON) in the same tab8. The table refreshes; the status bar reports matched rows9. Save the graph as GraphML (Ctrl+S) to persist the changesWhat can be edited
Nodes
| Column | Effect |
|---|---|
Label | Updates node label |
Size | Updates node size |
Color | Updates color (hex) |
Visible, Shape | Skipped silently |
| Any other column | Added/updated as a custom attribute |
Edges
| Column | Effect |
|---|---|
Weight | Updates edge weight |
Label | Updates edge label |
Color | Updates color (hex) |
Relation | Skipped silently |
| Any other column | Added/updated as a custom attribute |
Key properties
- Heterogeneous: each node/edge can have a different value — unlike in-app operations that assign one value to many targets at once.
- Non-destructive by default: only columns present in the file are touched; omitted columns are left unchanged.
- Full lossless roundtrip: exporting then re-importing without edits is a no-op — no duplicate columns, no data loss.
- External-tool-friendly: any tool that reads/writes CSV or JSON works; no plugin required.
Example: annotating nodes from an external analysis tool
You have a Python script that computes a custom community label for each node and writes the results to communities.csv:
#,community1,A2,A3,B4,CImport this file in the Nodes tab (ID column = #, match by node number). The community column becomes a custom attribute on each node. You can then use Filter by Attribute (community = A) to isolate that community in the visualization.
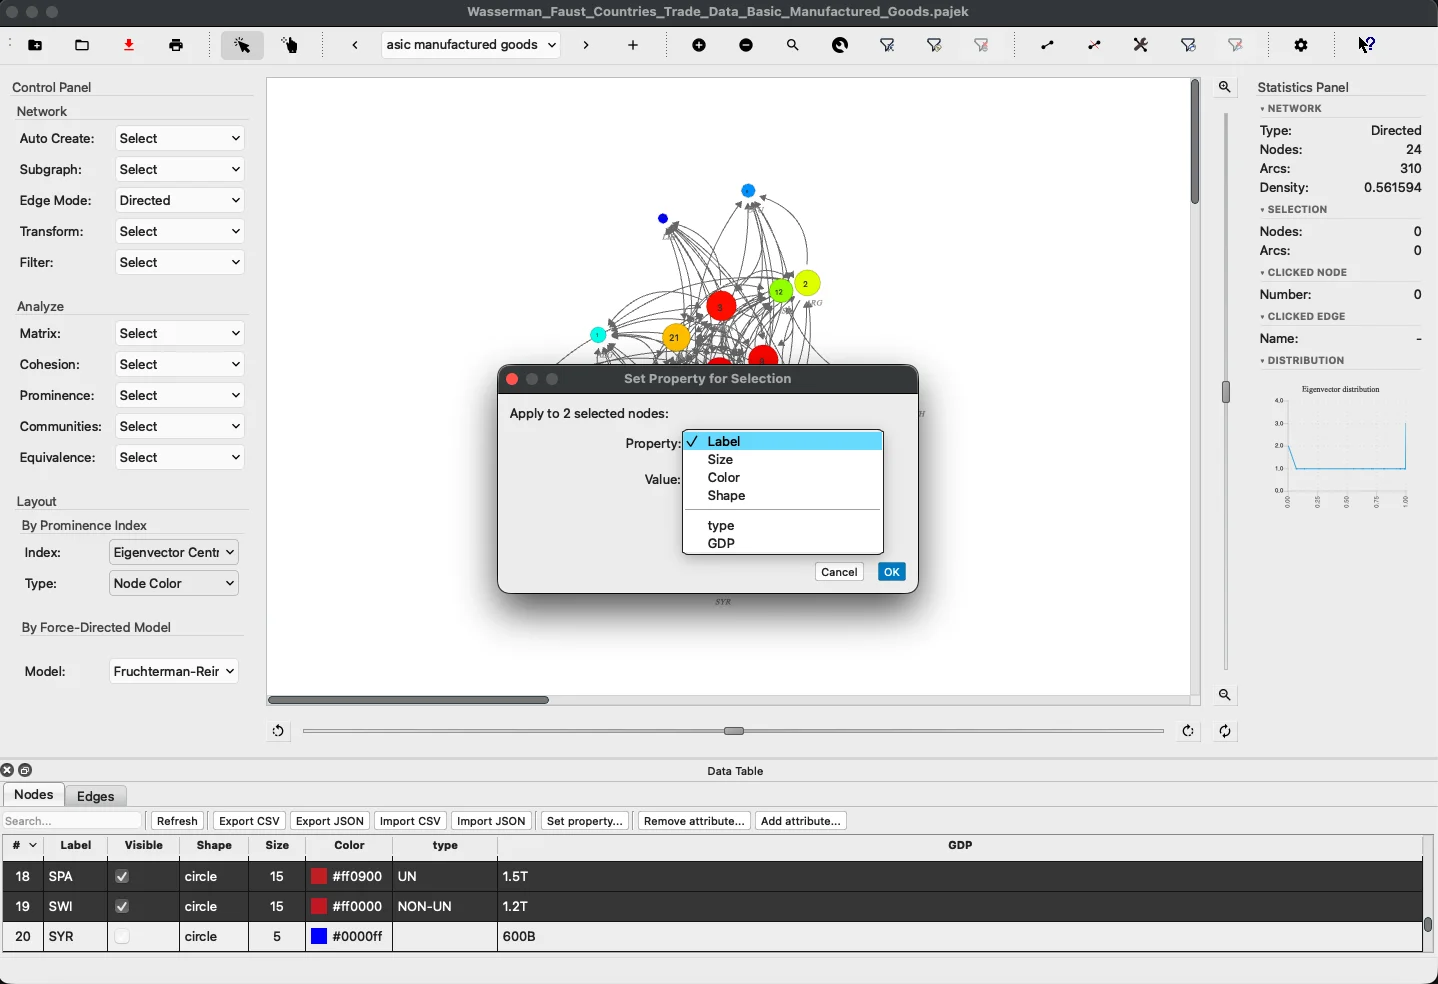
In-App Bulk Editing
Beyond inline cell editing (double-click a cell in the table), the Data Table dock provides three bulk operations that apply the same change to multiple nodes or edges in one step.
How to access
| Entry point | How |
|---|---|
| Data Table toolbar | Buttons at the top of each tab: Set property, Add attribute, Remove attribute |
| Canvas context menu | Right-click a node or edge (with one or more selected) → Set property for selection… |
The operations target:
- Selected rows in the table (use
Ctrl+clickor drag to select multiple rows). - All canvas-selected items (the table selection syncs automatically when you select nodes on the canvas).
- If nothing is explicitly selected, the operation targets all proxy-visible rows — i.e., all rows not hidden by the live search filter (which integrates naturally with any active exploration filter).
Set Property
Opens the Bulk Edit dialog, which adapts to the scope (Nodes or Edges):
| Scope | Available properties |
|---|---|
| Nodes | Label, Size, Color, Shape, and all existing custom attribute keys |
| Edges | Label, Weight, Color, and all existing custom attribute keys |
The value widget changes to match the chosen property (text field, number spinbox, color picker, or shape dropdown). Clicking Apply sets the chosen property to the given value on every target node or edge.
Add Attribute
Prompts for a key and a value, then adds that custom attribute to every target node or edge. If an attribute with the same key already exists on a target, its value is overwritten.
Remove Attribute
Collects all custom attribute keys present across the target nodes or edges and lets you pick one to remove. The chosen attribute is deleted from every target.
Combining Data Management with Filtering
Custom attributes unlock attribute-based filtering. The typical workflow:
- Import or manually enter attributes (e.g.
type,country,score). - Use Edit → Filter → By Attribute (
Ctrl+X, Ctrl+A) to show only nodes/edges matching a condition (e.g.type = investor,score > 0.8). - Export the visible rows from the Data Table dock to extract the filtered subset.
- Or apply the Ego Network filter on a selected node, then export its neighborhood’s data.
See Filtering and Graph Exploration for the full filter reference.