
User Interface and Getting Started
Learn how to navigate and use SocNetV’s intuitive interface to create, analyze, and visualize social networks. This page covers essential workflows to get you started, including network creation, editing, and customization, alongside a detailed overview of menus, toolbars, and panels.
User Interface overview
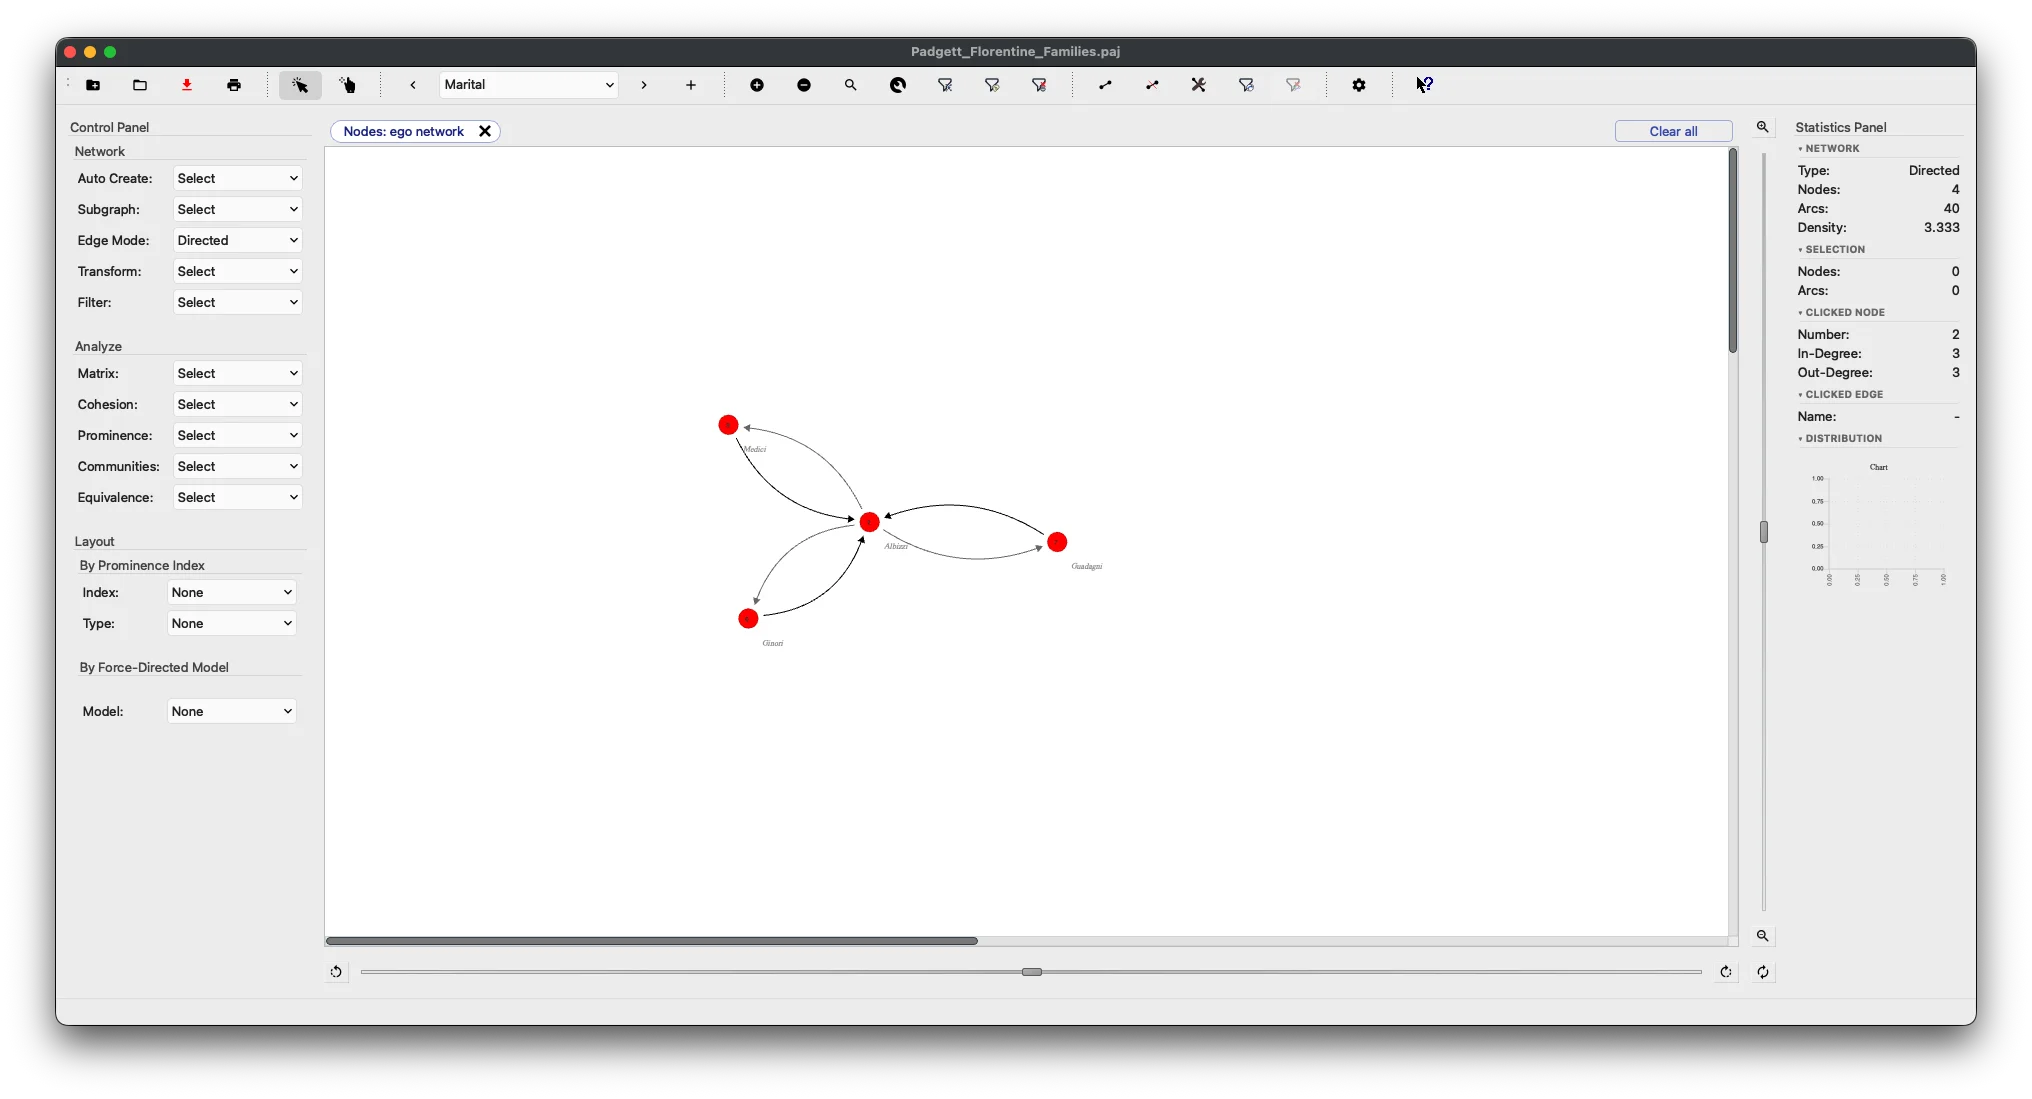
SocNetV has a simple yet powerful Graphical User Interface (GUI) that is designed to be user-friendly and highly functional, catering to both novice users and experienced researchers.
It allows users to visualize, manipulate, and analyze complex social networks with ease. Whether you’re a student exploring social network theory or a professional conducting in-depth research, SocNetV’s user interface ensures a seamless workflow.
The interface consists of the following components:
- The Menu
- Toolbar
- Sidebars
- Canvas
- A Filter Bar that appears automatically between the toolbar and the canvas when any graph filter is active.
- A status bar with helpful runtime messages.
The main application window is structured to provide maximum efficiency. Side panels on the left and right host critical tools and information, while the central canvas is the primary area for network visualization and interaction.
The Menu
At the top of the window, the menu bar provides access to all application features and functions. It includes six menus:
-
Network: Options for managing networks:
- Create new networks or load existing ones.
- Save, export, or import networks in various formats (GraphML, Pajek, GML, etc.).
- Generate random networks using predefined models or crawl the web for network creation.
-
Edit: Tools for modifying the network:
- Add or remove nodes and edges.
- Change node and edge properties (color, size, weight, labels, custom attributes, etc.).
- Filter submenu: non-destructive exploration filters (ego network, focus on selection, attribute-based, query builder, centrality, edge weight) and restore actions.
- Toggle the Data Table dock (
Ctrl+D) for tabular node/edge editing, export, and import.
-
Analyze: Advanced analysis tools:
- Compute graph and network metrics like adjacency matrices, clustering coefficients, centrality measures, and community detection.
- Generate detailed HTML reports for results.
-
Layout: Visualization customization:
- Apply layouts based on prominence metrics (e.g., Degree Centrality).
- Use force-directed algorithms (e.g., Kamada-Kawai, Fruchterman-Reingold) for intuitive network visualization.
- Apply an ego-centered radial layout to focus on a selected node and its neighborhood.
-
Options: General application settings:
- Toggle visibility of edges, arrows, and labels.
- Adjust antialiasing and other display settings.
-
Help: Access user guides, documentation, and support resources.
Each menu option is complemented by keyboard shortcuts, making navigation faster for experienced users.
Toolbar
The toolbar is positioned directly beneath the menu bar and offers one-click access to frequently used commands:
- File Operations:
- Create new networks.
- Load, save, or print the active network.
- Edit Tools:
- Add or remove nodes and edges.
- Toggle node and edge modes for quick modifications.
- Analysis Shortcuts:
- Direct access to centrality measures, clustering, and other analysis tools.
- Visualization Settings:
- Quickly switch between layout algorithms or modify the appearance of the network.
- Relation Management:
- Switch between relations in a multi-relational network.
- Add new relations or edit existing ones.
The toolbar icons are intuitive and provide tooltip hints when hovered over, ensuring ease of use for beginners.
Sidebars
Control Panel
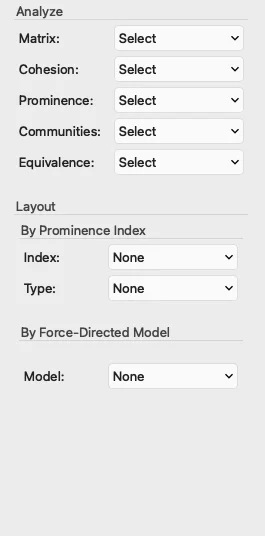
The Control Panel, located on the left, is designed for quick access to essential actions and commands. It is divided into three main groups:
-
Network Actions:
- Create random networks (e.g., Erdős–Rényi, Watts-Strogatz).
- Transform networks (e.g., symmetrize edges or convert directed networks to undirected ones).
- Subgraph creation based on selected nodes.
-
Analysis Tools:
- Compute various matrices (e.g., adjacency, Laplacian, degree).
- Measure network cohesion, centrality, and prominence metrics.
- Perform community detection (e.g., cliques, triad census).
- Analyze structural equivalence using hierarchical clustering.
-
Layout Models:
- Apply visual layouts based on metrics like Betweenness Centrality.
- Use force-directed placement algorithms for realistic visualizations.
- Layouts apply immediately when you change a combobox selection — there is no separate Apply button. The Type combobox defaults to None; selecting a Force-Directed model clears any active Radial/Level type, and vice versa.
Each action in the Control Panel mirrors corresponding menu options, providing a more accessible alternative for frequent operations.
Statistics Panel
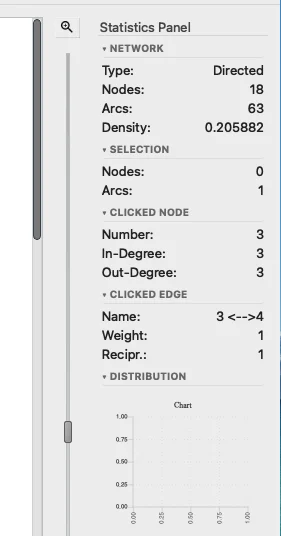
The Statistics Panel, located on the right, provides detailed information about the network and its components. It is divided into five collapsible sections, each with a ▾/▴ toggle header that expands or collapses that section independently:
- NETWORK — overall statistics: node count, edge count, density, network type (directed/undirected).
- SELECTION — statistics about the currently selected nodes or edges.
- CLICKED NODE — in-degree, out-degree, clustering coefficient, and other per-node data for the most recently clicked node. In-Degree/Out-Degree rows are hidden until a node is clicked.
- CLICKED EDGE — weight, label, color, and custom attributes for the most recently clicked edge. Weight/Reciprocal rows are hidden until an edge is clicked.
- DISTRIBUTION — distribution chart for the last computed prominence index.
The panel updates dynamically as you interact with the network.
Canvas
The Canvas is the central workspace where networks are visualized and manipulated. It supports intuitive interaction methods, including:
-
Node Interaction:
- Left-click on a node to select it.
- Drag nodes to reposition them within the network.
- Double-click on empty canvas space to add a new node.
- Right-click on a node to access its context menu for editing properties like color, label, and size.
-
Edge Interaction:
- Middle-click on two nodes to create a directed edge between them.
- Right-click on an edge to modify its weight, color, or delete it.
-
Zoom and Pan:
- Use the mouse wheel to zoom in or out.
- Drag the canvas to pan across the network.
- Zooming stays anchored to wherever you last panned, rather than jumping back to the network’s center — useful for zooming in on a corner of a large network without losing your place.
- Press
Ctrl+0to reset the view to a tight, margin-free fit of the whole network.
The canvas background is customizable, allowing users to select colors that suit their preferences or enhance visualization clarity.
Additional Features
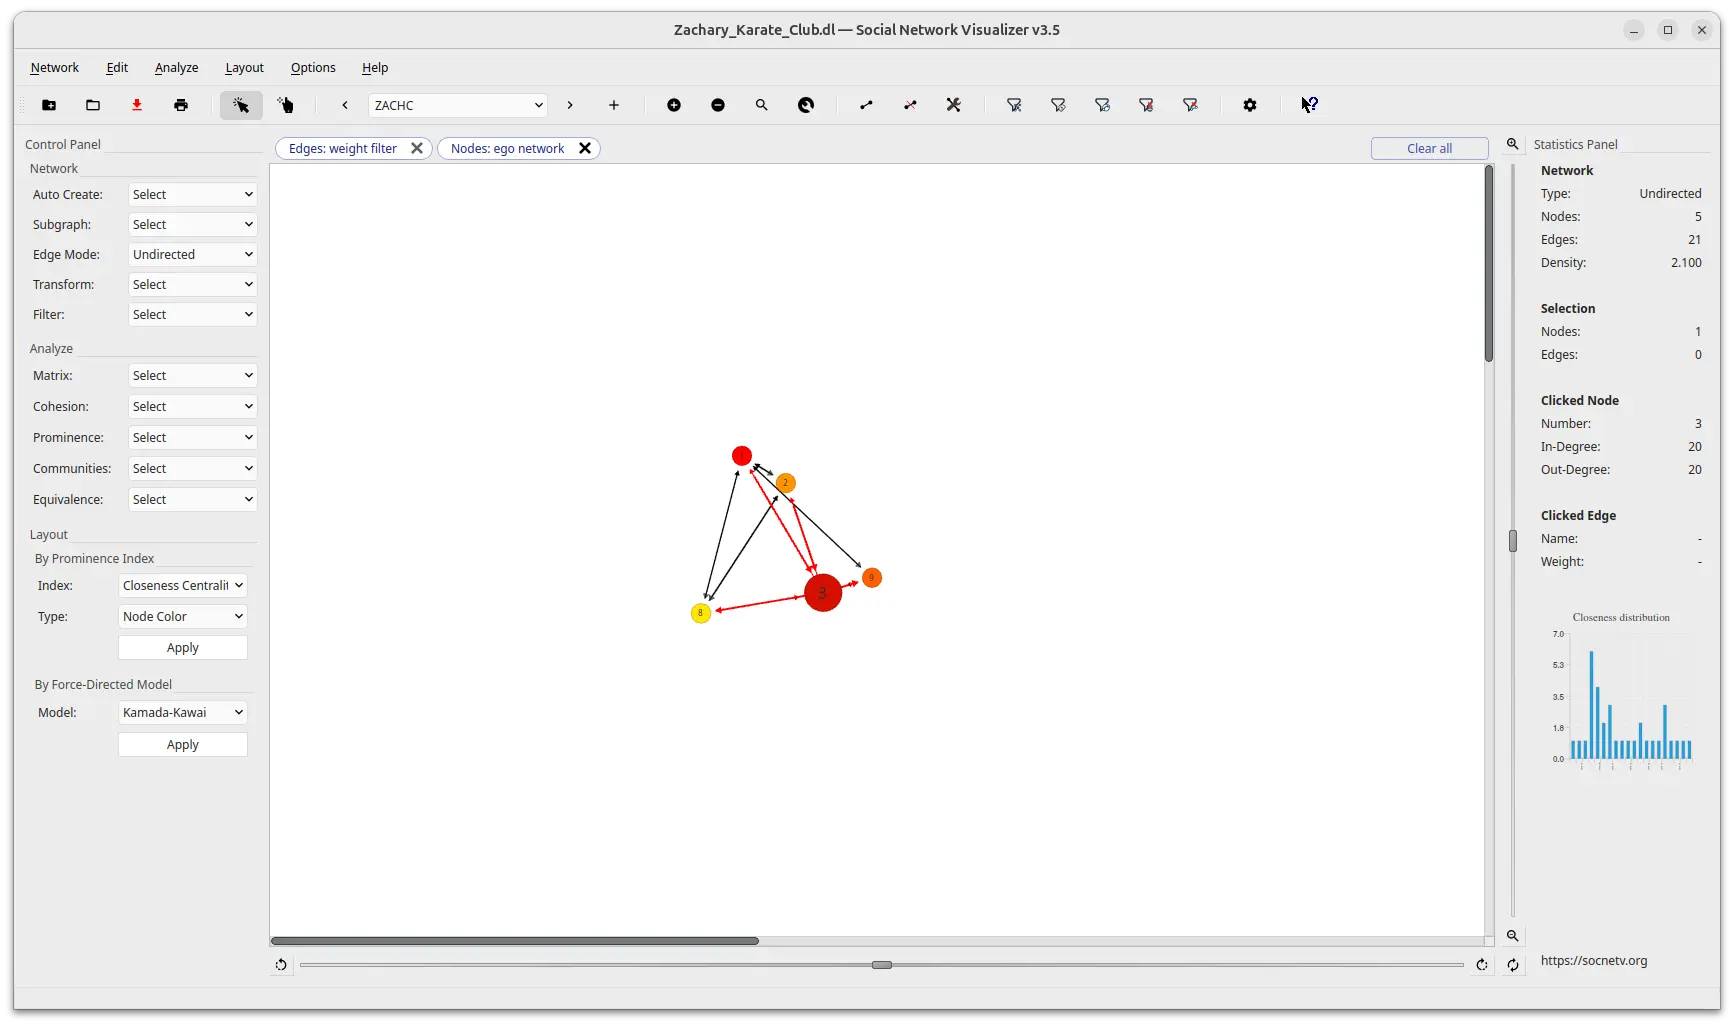
Filter Bar
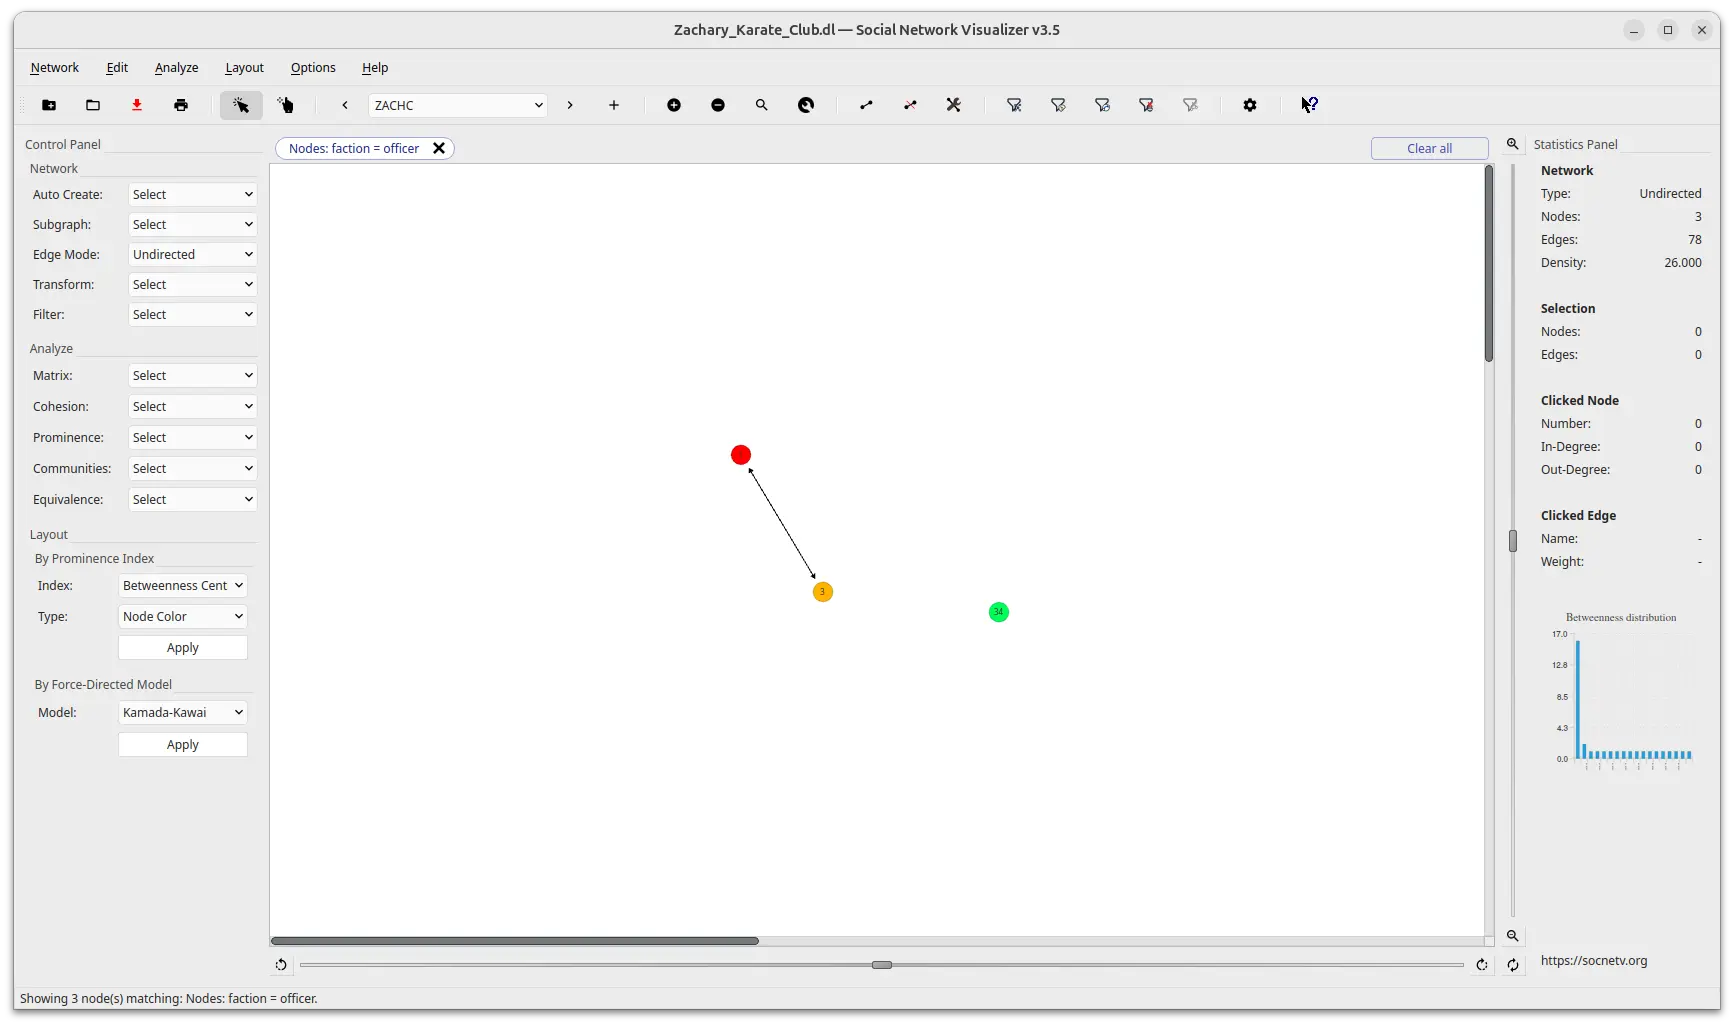
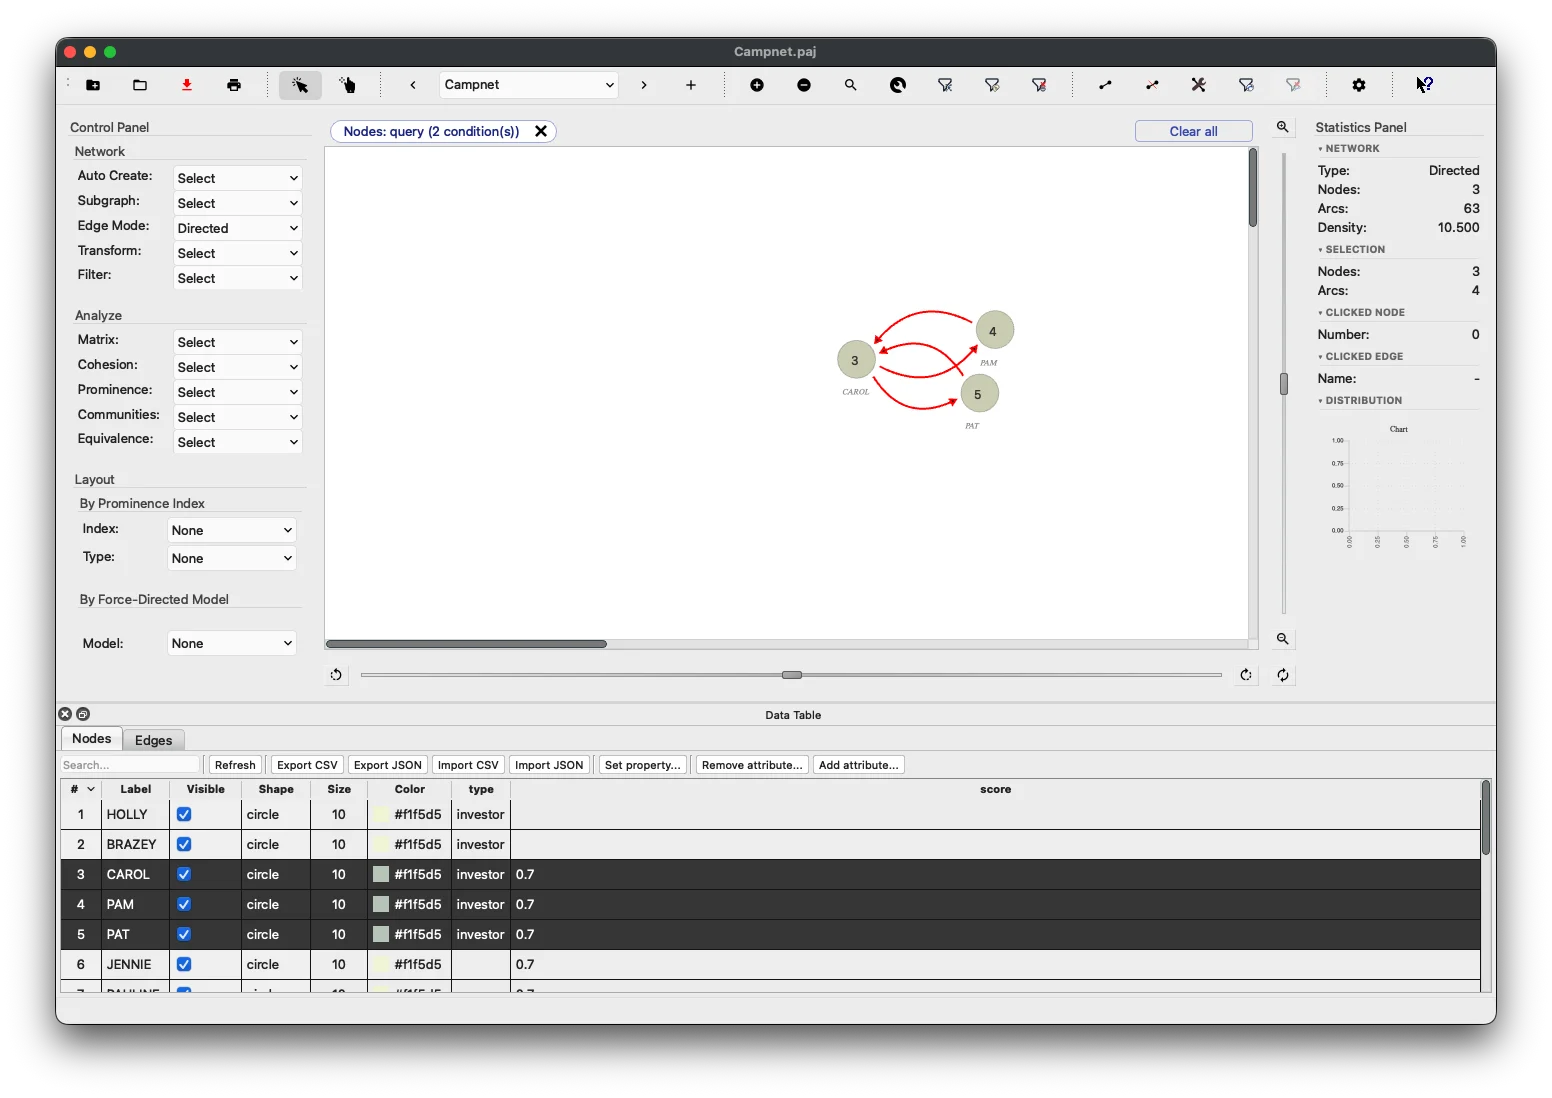
The Filter Bar is a thin strip that appears automatically between the toolbar and the canvas whenever a graph filter is active. It disappears when no filters are active. Each active filter condition is shown as a labelled chip (e.g. Nodes: ego network, Nodes: type = investor). Click the × on the most recent chip to remove that filter, or click Clear all to remove all filters at once.
See Filtering and Graph Exploration for the full reference.
Status Bar
The status bar at the bottom of the window provides helpful runtime messages, such as:
- Warnings about unsupported actions.
- Notifications about completed analysis tasks, export file paths, and import results.
- Hints and instructions based on the current context.
Tooltips and Context Menus
- Almost every element in SocNetV has an associated tooltip that provides quick information about its function.
- Right-click context menus on nodes, edges, and canvas offer a faster way to access frequently used options.
Accessibility and Customization
- Keyboard Shortcuts: Many commands can be executed using predefined shortcuts, enhancing accessibility for advanced users.
- Localization: SocNetV supports multiple languages, making it accessible to users worldwide.
Working with SocNetV
Below, we describe how to work with SocNetV.
Network Creation
To start working with SocNetV, you need network data, i.e., a graph of nodes (vertices) and links (edges). You can load a network from a file or “draw” nodes and edges by pointing and clicking on the canvas.
Ways to Create/Edit Nodes and Links:
- From the menus.
- Using the keyboard
- By right/left/middle/double-clicking on the canvas.
Creating and Handling Nodes
To create a new node:
- Double-click on the canvas.
- Click on the “Add Node” toolbar button.
- Press
CTRL+.
You can move a node by dragging it with the left mouse button. When dragging a node, SocNetV highlights all its adjacent edges.
Right-clicking on a node opens a context menu to:
- Change node properties (e.g., color, size, label, custom attributes).
- Delete the node.
- Add an edge.
- Apply an Ego Radial Layout centered on that node (
Ctrl+Alt+E). - Focus on Ego Network: hide all nodes except the selected node and its direct neighbors (
Ctrl+X, Ctrl+F). - Focus on Selection: hide all nodes not in the current selection (
Ctrl+X, Ctrl+O). - Restore All Nodes: reveal all nodes hidden by any active filter (
Ctrl+X, Ctrl+R).
All nodes are tagged with their node number by default. To display labels, enable the option in Options -> Node -> Display Labels.
In large networks, finding specific nodes can be challenging. Use CTRL+F to search for nodes by number or label. Press CTRL+F again to undo the highlight.
From the Node Properties dialog, you can:
- Enter a node label.
- Adjust size and select a color.
- Choose a built-in shape (circle, rectangle, diamond, ellipse, triangle, star, and more) from the shape dropdown.
- Set a Custom Icon: click the
…button to browse for any image file on your disk — SocNetV will use it as the node’s icon on the canvas. - Add, edit, or remove custom key/value attributes in the Custom Attributes table. Type a key and value in the fields at the bottom and click Add; select a row and click Remove selected to delete it. Custom attributes are saved when using the GraphML format.
Group Selection
To select multiple nodes:
- Hold the left mouse button and drag to create a selection rectangle.
- All nodes inside the rectangle are selected.
- Right-click one of the selected nodes to edit all selected nodes together in the Node Properties dialog.
Creating and Editing Edges
To create an edge:
- Middle-click or double-click on the source node, then do the same on the target node.
By default:
- New links have a weight of
w = 1. - You can change the weight by right-clicking on the edge and selecting “Change Weight.”
You can also create edges using:
- Right-click: Select “Create Edge” and specify the source/target node and edge weight in the dialog.
- Control Panel: Click the “Add Edge” button and enter source/target nodes and weight.
- Keyboard: Press
CTRL+/to specify source/target nodes and weight.
Example
Create a directed edge from Node 1 to Node 2:
- Middle-click on Node 1 (the mouse pointer becomes a hand).
- Middle-click on Node 2.
A new line appears, indicating the directed edge.
Zero-weight Edges
Some weighted network files (e.g. weighted edge lists exported from other tools) may contain edges whose weight is exactly 0. SocNetV imports and draws these edges so your data is rendered faithfully, but it excludes them from every SNA computation — they do not contribute to degree, density, reciprocity, clustering coefficient, geodesic distances, or any centrality measure.
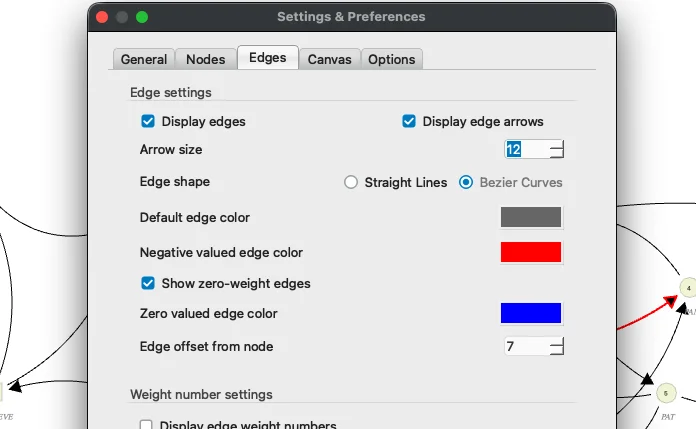
The Options → Settings → Edges tab controls all edge display settings:
| Setting | Location in Settings dialog | Default |
|---|---|---|
| Display edges | Edges tab → Display edges checkbox | on |
| Display edge arrows | Edges tab → Display edge arrows checkbox | on |
| Arrow size | Edges tab → Arrow size spinbox (range 2–20) | 6 |
| Edge shape | Edges tab → Straight Lines / Bezier Curves radio | Straight Lines |
| Show zero-weight edges | Edges tab → Show zero-weight edges checkbox | on |
| Zero edge color | Edges tab → Zero valued edge color button | blue |
| Save zero-weight edges | File tab → Save zero-weight edges (GraphML only) checkbox | off |
- Arrow size — controls the size of arrowheads on directed edges (range 2–20). The change applies to all edges immediately and is persisted for future sessions.
- Edge shape — switch between Straight Lines (default) and Bezier Curves (smooth quadratic arcs). See Bezier Curve Edges below.
- Show zero-weight edges — when checked (default), zero-weight edges are drawn on the canvas. Uncheck this if your data does not contain zero-weight edges and you want to make sure no ghost edges appear.
- Zero edge color — choose any color for zero-weight edges so they are visually distinct from normal edges. The change is applied immediately and becomes the default for all future sessions.
- Save zero-weight edges — when enabled, zero-weight edges are written to GraphML files on save. Disabled by default.
Bezier Curve Edges
Toggle Options → Settings → Edges → Edge shape → Bezier Curves (or use Options → Edges → Bezier Curves from the menu) to draw all edges as smooth quadratic arcs instead of straight lines.
- Arrowheads follow the curve tangent at each endpoint.
- Reciprocated edges (A→B and B→A) curve in opposite directions so both arcs are clearly visible.
- New edges drawn while the toggle is on are born as curves.
- The setting persists across sessions.
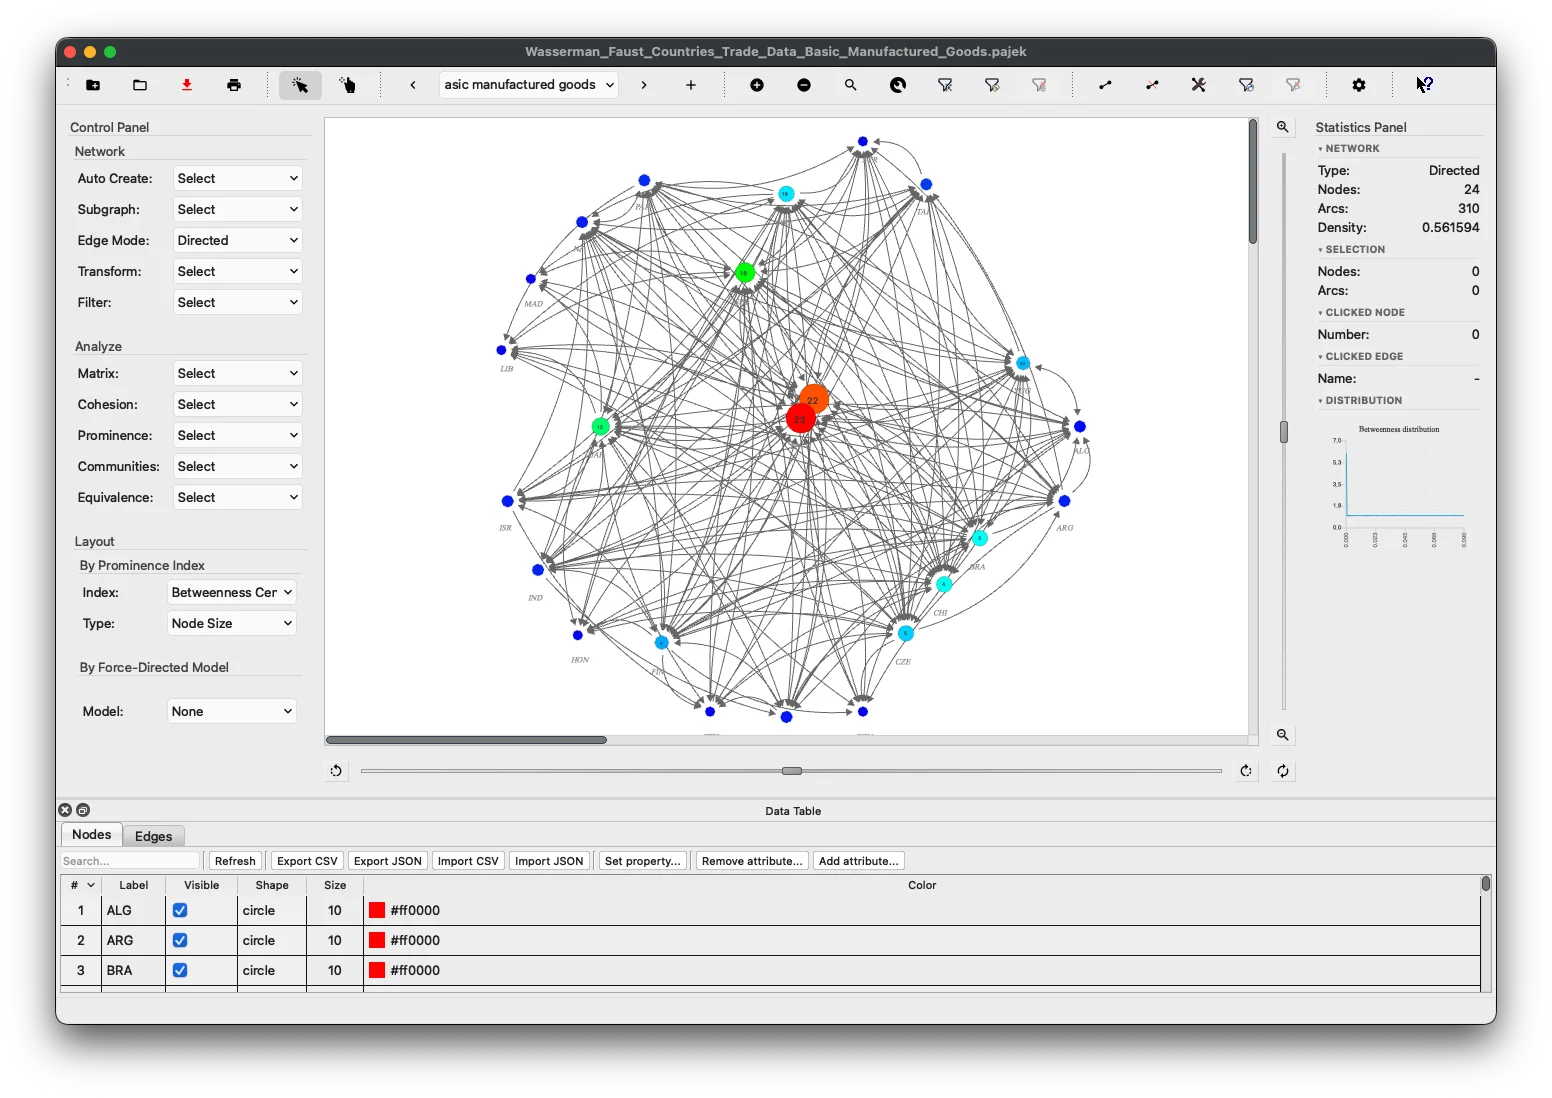
Relations
When you create your first edge, SocNetV asks you to name the relationship (e.g., “friendship”).
A relation represents a specific type of tie between nodes.
- Multi-relational networks: SocNetV supports networks with multiple types of ties (e.g., friendships and business relationships).
- Add new relations using the
+button in the toolbar. - Navigate between relations using the arrow buttons in the toolbar.
Basic Functions in the Network Menu
Loading a Network
To load network data in a supported format (e.g., GraphML, GML, Pajek):
- Select
File -> Load. - Use the file dialog to navigate to your file.
For unsupported formats, use File -> Import.
File Previewer
When loading a file, SocNetV shows a File Previewer, allowing you to:
- Adjust the file’s codepage (e.g., UTF-8, Windows-1253).
- Ensure proper display of non-Latin characters.
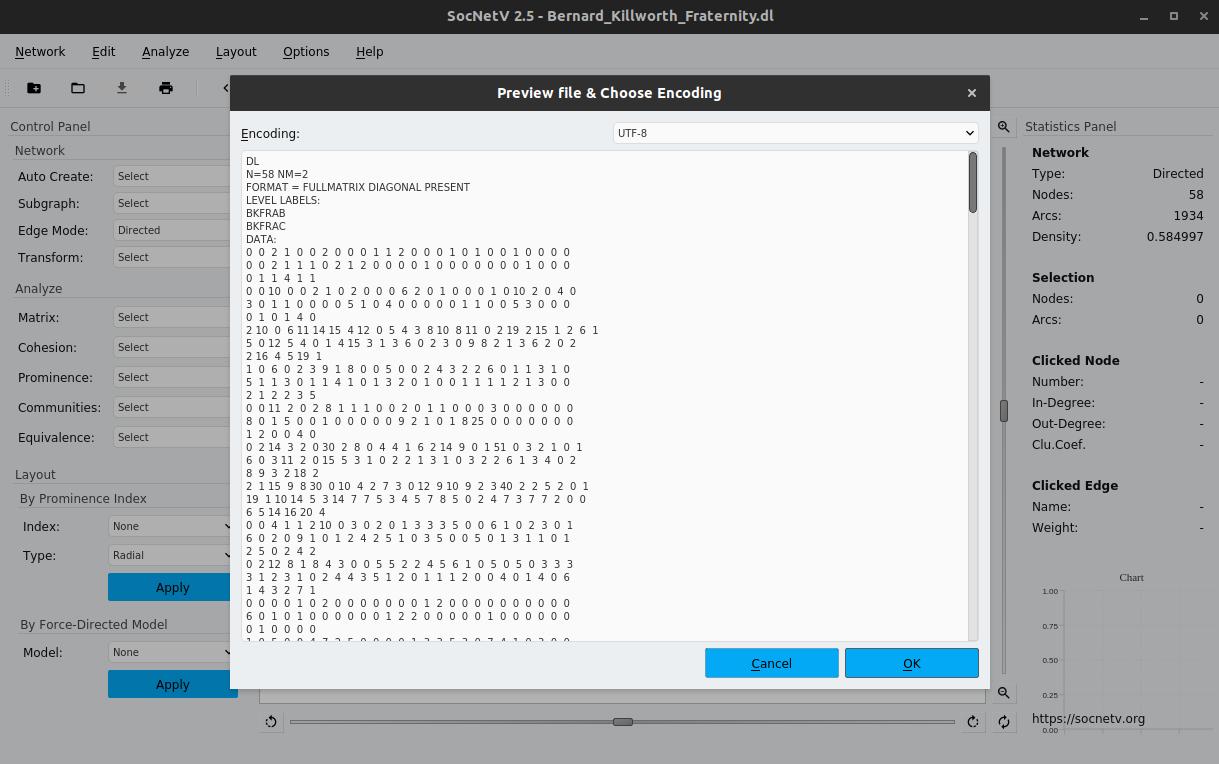
In the File Previewer, select a codepage for the opened file.
Note:
- The default codepage is UTF-8.
- Use other codepages (e.g., KOI8-R for Russian) only if necessary.
Saving a Network
To save the active network:
- Press
CTRL+Sor selectFile -> Save.
Default format: GraphML.
Export to other formats via Network -> Export To.
Viewing or Plotting the Adjacency Matrix
- Press
F6to view the adjacency matrix.
Each element represents the weight of the edge from node to node . if there is no edge. - Press
Shift+F6to plot the adjacency matrix.
Using Known Datasets
SocNetV can recreate well-known datasets. See Recreating Famous Datasets.
Random Network Creation
SocNetV can generate random networks based on various models. See Network Generation.
Web Crawler
SocNetV includes a web crawler to analyze networks of web pages. See Web Crawler Documentation.
Printing and Exporting
To print:
- Press
CTRL+P.
SocNetV follows a WYSIWYG approach: what you see on the canvas is what you print.
For high-quality output, export to vector-based PDF.
Report Output Format: HTML or CSV
Most reports written by the Analyze menu — matrices (Adjacency, Distances, Geodesics, Reachability, Laplacian, Degree, Cocitation, Transpose, Inverse Adjacency, Walks), every Centrality and Prestige index, Reciprocity, Eccentricity, Clustering Coefficient, and Triad Census — can be written in either of two formats, set once for the whole application:
- Options → Settings → Reports → Output format: choose HTML (the default) or CSV.
HTML opens in the built-in report viewer / your default browser, with prose explanations, summary statistics, and (where applicable) charts. CSV is a lean, table-only alternative with just the raw numbers — no prose or charts — that opens directly in your system’s default spreadsheet application, making it convenient to import scores into Excel, R, Python, or similar tools for further analysis.
Exploring Large Networks
SocNetV includes several tools designed to help you explore and make sense of large, dense networks.
Ego Radial Layout
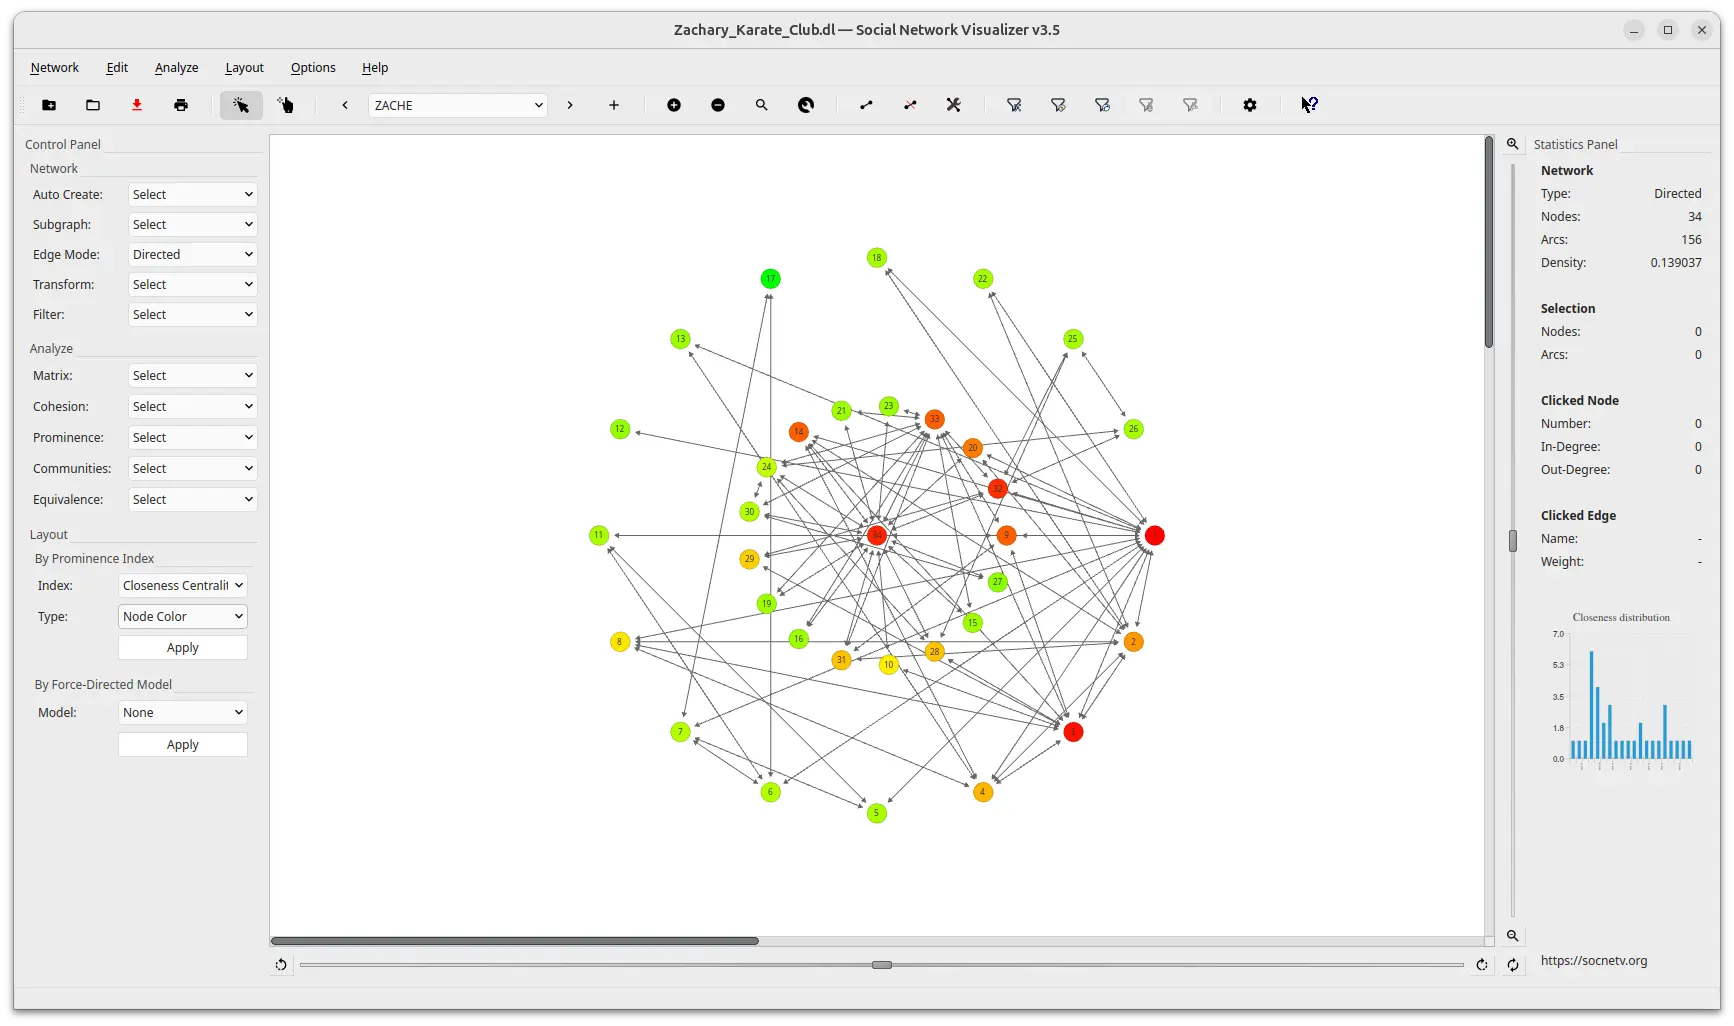
The Ego Radial Layout focuses the visualization on a single node and its immediate neighborhood.
To apply it:
- Select one node on the canvas, then go to
Layout→Ego Radial Layout, or pressCtrl+Alt+E. - Right-click any node and select
Ego Radial Layoutfrom the context menu.
The selected node is placed at the canvas center. Its 1-hop out-neighbors are arranged on an inner ring, and all remaining nodes are placed on an outer ring. Guide circles are drawn to mark each ring.
This layout pairs well with the Ego Network filter (Edit → Filter Nodes → Ego Network), which hides all nodes outside the ego’s neighborhood entirely.
Force-Directed Layouts for Large Graphs
SocNetV’s force-directed layout algorithms have been optimized for large networks:
- Fruchterman-Reingold: Uses O(1) adjacency lookup per iteration and exits early when the layout converges, significantly reducing computation time for dense graphs.
- Kamada-Kawai: Improved boundary handling prevents nodes from being teleported to random positions when they move outside the canvas area.
- Eades Spring Embedder: Faithful implementation of the 1984 model with linear cooling and convergence detection.
To apply a force-directed layout, use the Control Panel → By Force-Directed Model, or go to Layout → Force-Directed.
Filtering and Graph Exploration
SocNetV v3.5 introduces a comprehensive non-destructive filtering system that lets you temporarily hide nodes and edges to focus on the parts of a network that matter — without deleting anything. All filters are reversible and stackable.
How Filters Work
Every filter operation pushes an entry onto an internal snapshot/restore stack. The graph structure is never modified — only the visibility of nodes and edges changes. You can apply multiple filters in sequence. Restoring reverses the last applied filter, or you can clear all filters at once.
Where to Find Filter Actions
All filter actions are available from multiple entry points:
| Entry point | How to access |
|---|---|
| Menu | Edit → Filter Nodes / Filter Edges |
| Toolbar | Dedicated filter group (distinct icon per action) |
| Control Panel | Filter combo in the Network group |
| Right-click menu | Right-click any node on the canvas |
| Keyboard | See shortcuts below |
Ego Network Filter
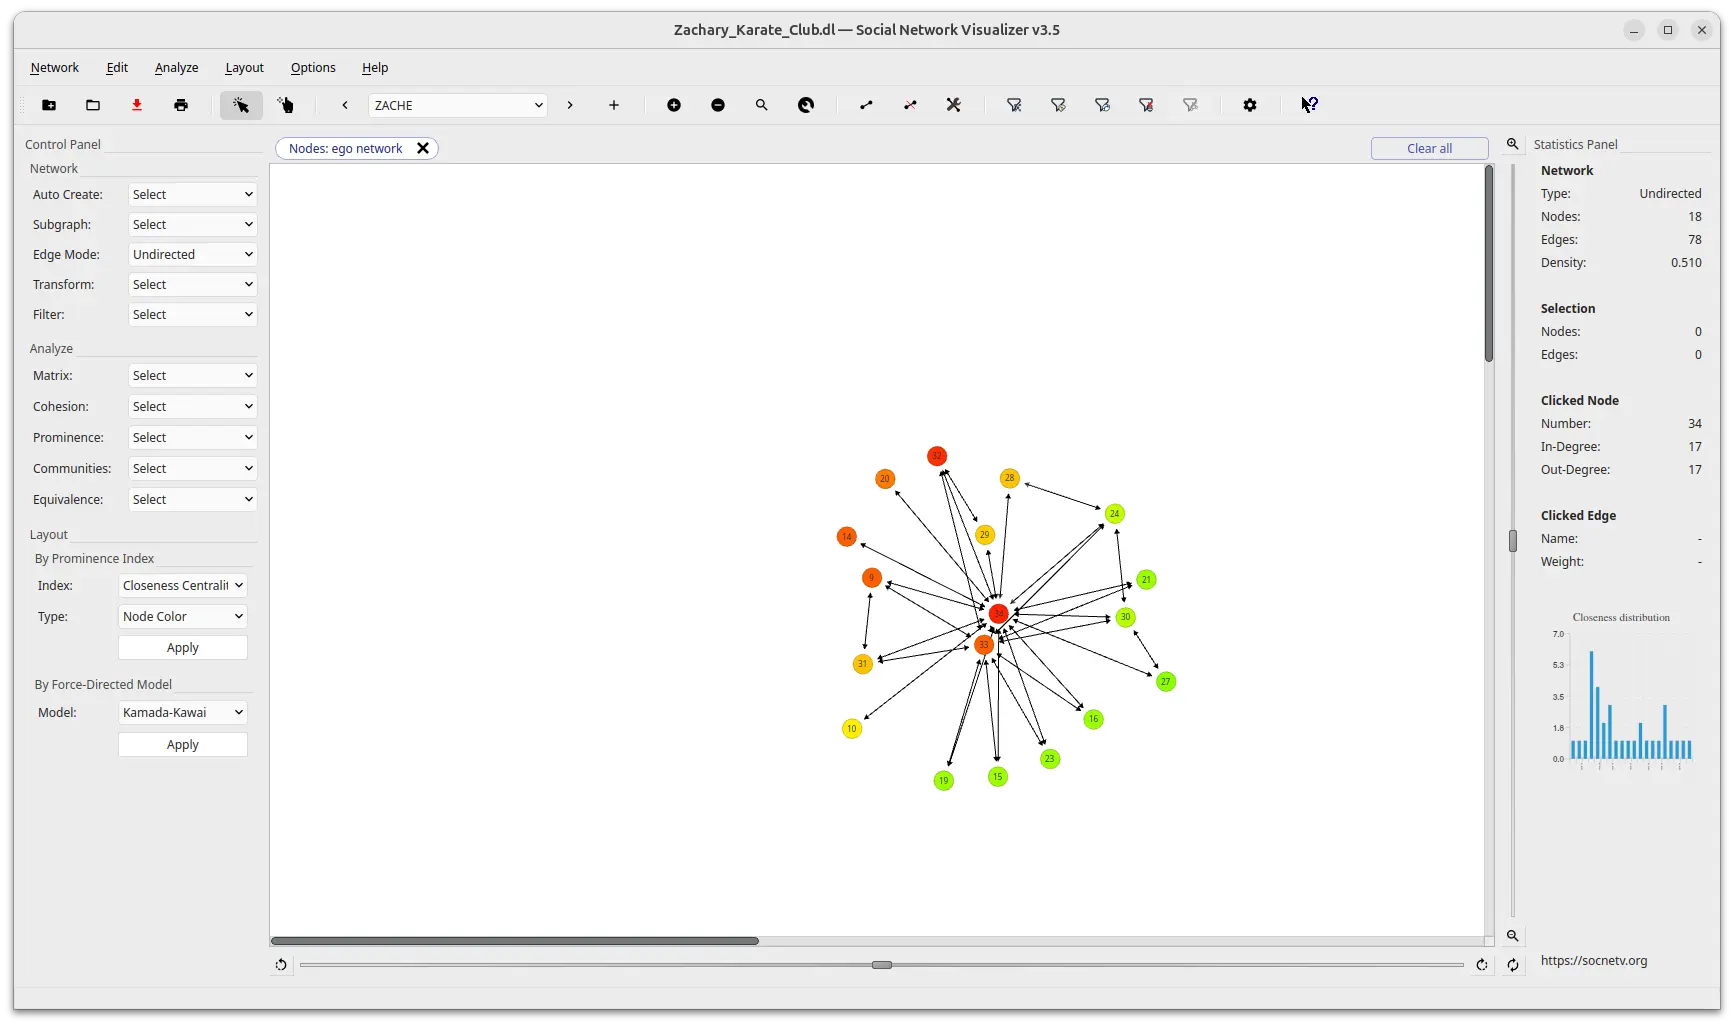
Focus on Ego Network shows only a selected node (the ego) and its immediate out-neighbors; all other nodes and all non-incident edges are hidden.
- Shortcut:
Ctrl+X, Ctrl+F - Right-click menu: Focus on Ego Network
- Menu: Edit → Filter Nodes → Ego Network
A single click on the canvas or the Restore action brings everything back.
Focus on Selection
Focus on Selection hides all nodes not currently selected, and all edges whose source and target are not both in the selection. Use group selection (drag a rectangle) or Ctrl+click to build the selection first.
- Shortcut:
Ctrl+X, Ctrl+O - Right-click menu: Focus on Selection
- Menu: Edit → Filter Nodes → Selection
Edge cases:
- No selection → no action.
- Single node selected → that node stays visible with no edges.
Filter by Attribute
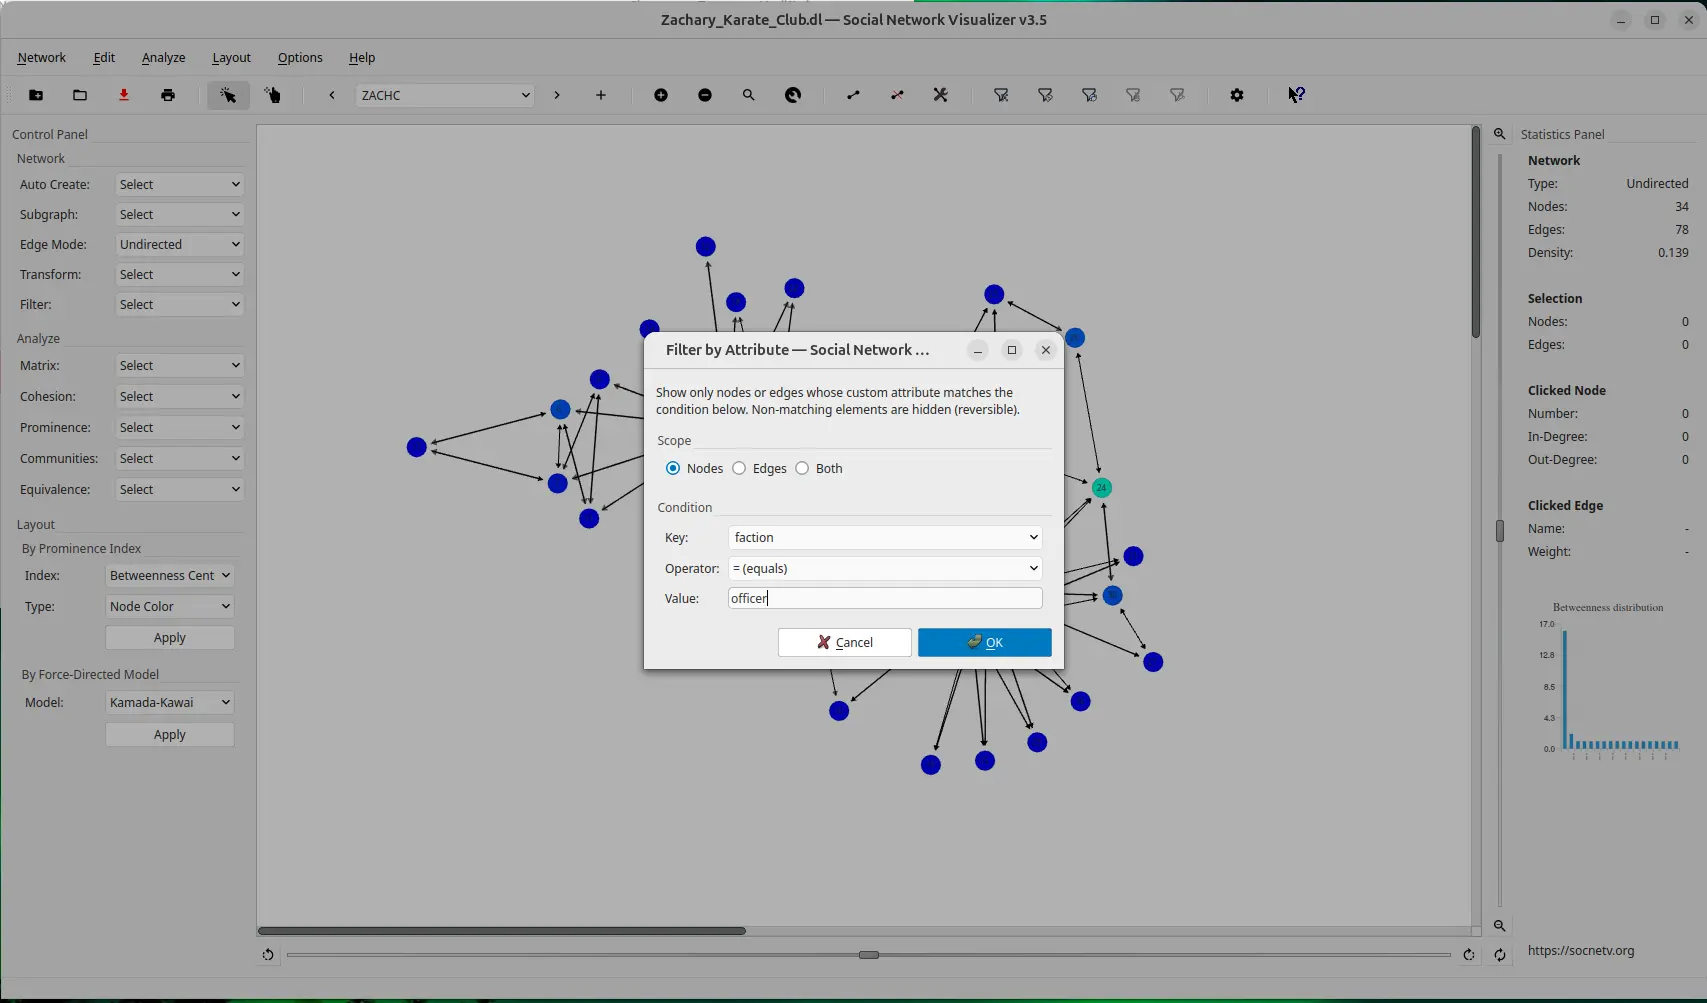
Filter by Attribute opens a dialog where you define a condition to hide nodes or edges that do not match.
- Shortcut:
Ctrl+X, Ctrl+A - Menu: Edit → Filter Nodes/Edges → By Attribute
In the dialog:
| Field | Options |
|---|---|
| Scope | Nodes / Edges / Both |
| Key | Select from existing attribute keys in the graph |
| Operator | = ≠ > < ≥ ≤ contains |
| Value | Free text (numeric-aware: compared as numbers when both sides parse as double; otherwise lexicographic; contains is case-insensitive substring) |
Click Apply to activate the filter. The canvas updates immediately and a chip appears in the Filter Bar.
See Data Management for how to add custom attributes to nodes and edges.
Query Builder
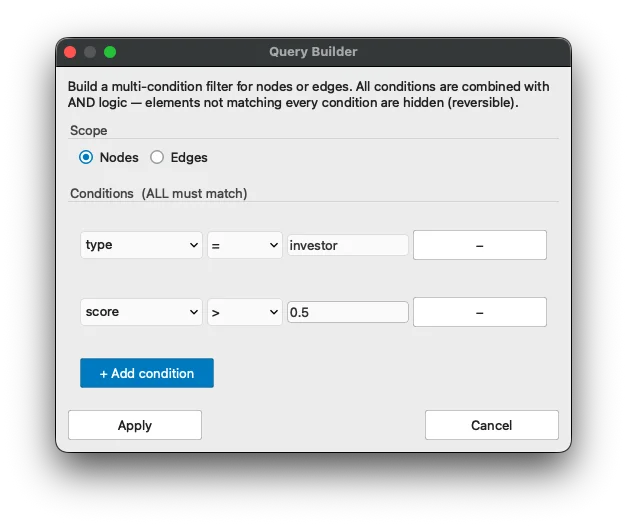
The Query Builder composes a multi-condition filter in one dialog. All conditions must be satisfied simultaneously (AND logic). A single chip is added to the filter bar for the entire compound query, and arbitrary chip removal works the same as for any other filter.
- Shortcut:
Ctrl+X, Ctrl+B - Menu: Edit → Filter → Query Builder…
- From Filter by Attribute: click the flat Use Query Builder… button at the bottom of that dialog to switch to the Query Builder without closing the current dialog.
How to use
- Open the Query Builder dialog.
- Choose the scope: Nodes or Edges.
- Each condition row has three fields:
Field Description Key Attribute name — choose from existing keys or type a custom one Operator =≠><≥≤containsValue Free text; numeric-aware (compared as doublewhen both sides parse; otherwise lexicographic;containsis case-insensitive substring) - Click + Add condition to add more rows. Click − to remove a row (at least one row is always kept).
- Click Apply. The dialog stays open so you can apply again with different conditions if needed. Click Cancel to close.
The filter bar shows a chip such as Nodes: query (2 condition(s)). Remove it with × to restore the hidden elements.
Filter Edges by Weight
Filter Edges by Weight hides edges whose weight falls below (or above) a threshold you set in the dialog.
- Menu: Edit → Filter Edges → By Weight
To re-enable all hidden edges, use Restore All Edges (Ctrl+E, Ctrl+R).
Filter Nodes by Centrality
The existing Filter Nodes by Centrality action now integrates into the unified snapshot/restore stack: Restore All Nodes also reverses centrality-based filters.
Restore All Nodes and Restore All Edges
| Action | Shortcut | What it does |
|---|---|---|
| Restore All Nodes | Ctrl+X, Ctrl+R | Pops the entire node-filter history stack, making all hidden nodes visible again. Works for ego, selection, attribute, and centrality filters. |
| Restore All Edges | Ctrl+E, Ctrl+R | Re-enables all edges hidden by the weight filter. |
Both are available in the Edit → Filter menu and the node right-click context menu.
Filter Bar
When any filter is active, a Filter Bar appears automatically as a thin strip between the toolbar and the canvas. It disappears automatically when no filters are active.
Each active filter condition is shown as a chip, for example:
[ Nodes: ego network × ] [ Nodes: type = investor × ] [ Nodes: query (2 condition(s)) × ] [Clear all]- The × on any chip removes that specific filter and replays all remaining filters in their original order — arbitrary removal is supported.
- Clear all removes every active filter in a single click.
Combining Filters
Filters compose by stacking — each application narrows down the visible set further, producing an AND effect. Example workflows:
- Select a cluster of nodes → Focus on Selection → apply Ego Radial Layout to visualize the subgraph cleanly.
- Query Builder (
type = investorANDscore > 0.5) in a single step — then Filter by Centrality (top 20%) to find the most connected matching nodes. - Filter by Attribute (
type = investor) → then Filter by Centrality (top 20%) to find the most connected investors. - Ego Network filter → export the visible nodes as CSV from the Data Table for further analysis.