SocNetV v2.2 released with cluster analysis, eigenvector centrality and many more features!

SocNetV: Social Network Analysis and Visualization Software

SocNetV v2.2 released with cluster analysis, eigenvector centrality and many more features!

SocNetV v2.2 released with cluster analysis, eigenvector centrality and many more features!

We are pleased to announce that a new version of your favorite social network analysis and visualization software application has been released. SocNetV version 2.2,  codenamed "beyond", brings many new features and it is available for Windows, Mac OS X and Linux. Visit the Downloads page to get it!

Here is a brief list of all new features and bugfixes.

Hierarchical Clustering Analysis (HCA)

SocNetV can now perform hierarchical agglomerative cluster analysis on a social network.  Supported methods: Single-linkage (minimum), Complete-linkage (maximum) and Average-linkg (UPGMA).

The Structural Equivalence matrix can be computed from the adjacency or the geodesic distances matrix using a user-selected distance metric such as Euclidean distance, Manhattan distance Jaccard distance etc.

The result of the HCA is the list of clusters per level and  a dendrogram of the clusters hierarchy in SVG format.

An example screenshot of HCA dendrogram:

Eigenvector Centrality

Version 2.2. adds support for yet another centrality metric: Eigenvector centrality. The Eigenvector centrality of each node in a social network  is defined as the ith element of the leading eigenvector of the adjacency matrix. The leading eigenvector is the eigenvector corresponding to the largest positive eigenvalue.

This metric can also be used for embedding radial or level layout in the network.

Pearson product moment correlation coefficients

SocNetV can now correlate actor profiles (ties or distances to other actors) and compute a correlation matrix of pair-wise Pearson coefficients. The computation is done on the given matrix (adjacency or distances) and can be applied on rows (outbound ties), columns (inbound ties) or both.

Actor Similarity

SocNetV can compare the pair-wise tie/distance profiles of actors in order to produce a similarity matrix.

You can select one of the supported measures (Simple Matching, Jaccard, Hamming, Cosine similarity or Euclidean distance).

The algorithm can compare rows (outbound links), columns or both of the input matrix.

Tie profile dissimilarities

SocNetV computes the pair-wise tie profile dissimilarities of the actors, using any of the supported "distance" metrics: Euclidean, Manhattan, Hamming, Jaccard, Chebyshev.

The algorithm uses the adjacency matrix as input. It can compare rows (outbound links), columns (inbound links) or both.

Maximal clique census

SocNetV now uses the Bron–Kerbosch algorithm to find all maximal cliques in an undirected or directed graph.

It produces a census of all MAXIMAL cliques in the network and reports some useful statistics about these.

The clique census report includes disaggregation by vertex and co-membership information. It even prints the cluster analysis dendrogram actor co-membership matrix.

Symmetrize edges by examining Strong Ties

Given a network, the user can create a new relation with only strong ties (when both a->b and b->a exist).

You can opt to create strong ties either from all relations or from current relation only.

Cocitation matrix

SocNetV computes and displays the cocitation matrix of the active social network.

The Cocitation matrix, C=A*A^T, is a NxN matrix where each element (i,j) is the number of actors that have outbound ties/links to both actors i and j.

Cocitation network

When a network is loaded, SocNetV can create a new symmetric relation by connecting actors that are cocitated by others.

In the new relation, an edge will exist between actor i and actor j only if C(i,j) > 0,  where C the Cocitation Matrix. Thus the actor pairs cited by more common neighbors will appear with a stronger tie between them than pairs those cited by fewer common neighbors.

Filter (temporarily disable) unilateral (non-reciprocal) edges.

This feature enables you to temporarily symmetrize a directed network by focusing only on the strong, reciprocal ties. Essentially, the program will disable temporarily all unilateral (non-reciprocal) edges.


Multi-relational data read and write in GraphML

SocNetV now supports reading and writing .graphml files with multiple relations. At the moment there is no option as to whether to write one or all relations of the current network to a file. If your network has multiple relations, they will all be saved in the selected GraphML file.

GML format support

The application can load and parse GML formatted network data. At the moment only graph, directed, node, edge, id and labels are supported.

Support for Multirelational directed networks in Pajek files

SocNetV can read Pajek files with multiple relations in *Arcs

Support for EdgeLists with labels

SocNetV can now parse simple and valued EdgeList files where the nodes are referenced by their labels.

HTML reports

SocNetV reports are now saved by default in HTML format. This allows us to have a vastly improved formatting in all reports, as you can see from the screenshots.

Also in Centrality and Prestige reports,  you can now sort the results by any column on-the-fly. Just click on the up-down arrow on the header of your preferred column to sort the table by the column contents (ascending or descending).

Note: By default, HTML reports are opened in the system web browser.

Adjacency matrix plot

SocNetV can now plot the adjacency matrix to a file using unicode chars:

Create basic subgraphs with one click

SocNetV can now create clique, star, cycle, and line subgraphs from a group of selected vertices. Just select a group of vertices and select a subgraph from "Selection Subgraph" in the Control Panel or right click on a node and select it in the popup menu (see screenshot below).


Improved performance

SocNetV can multiply matrices faster, by using a recursive Exponentiation by squaring or Fast Modulo multiplication algorithm.

Also, all TextEditor reporting windows will be closed on app exit/init
 
GUI: Revamped Control Panel and more app icons in the toolbar

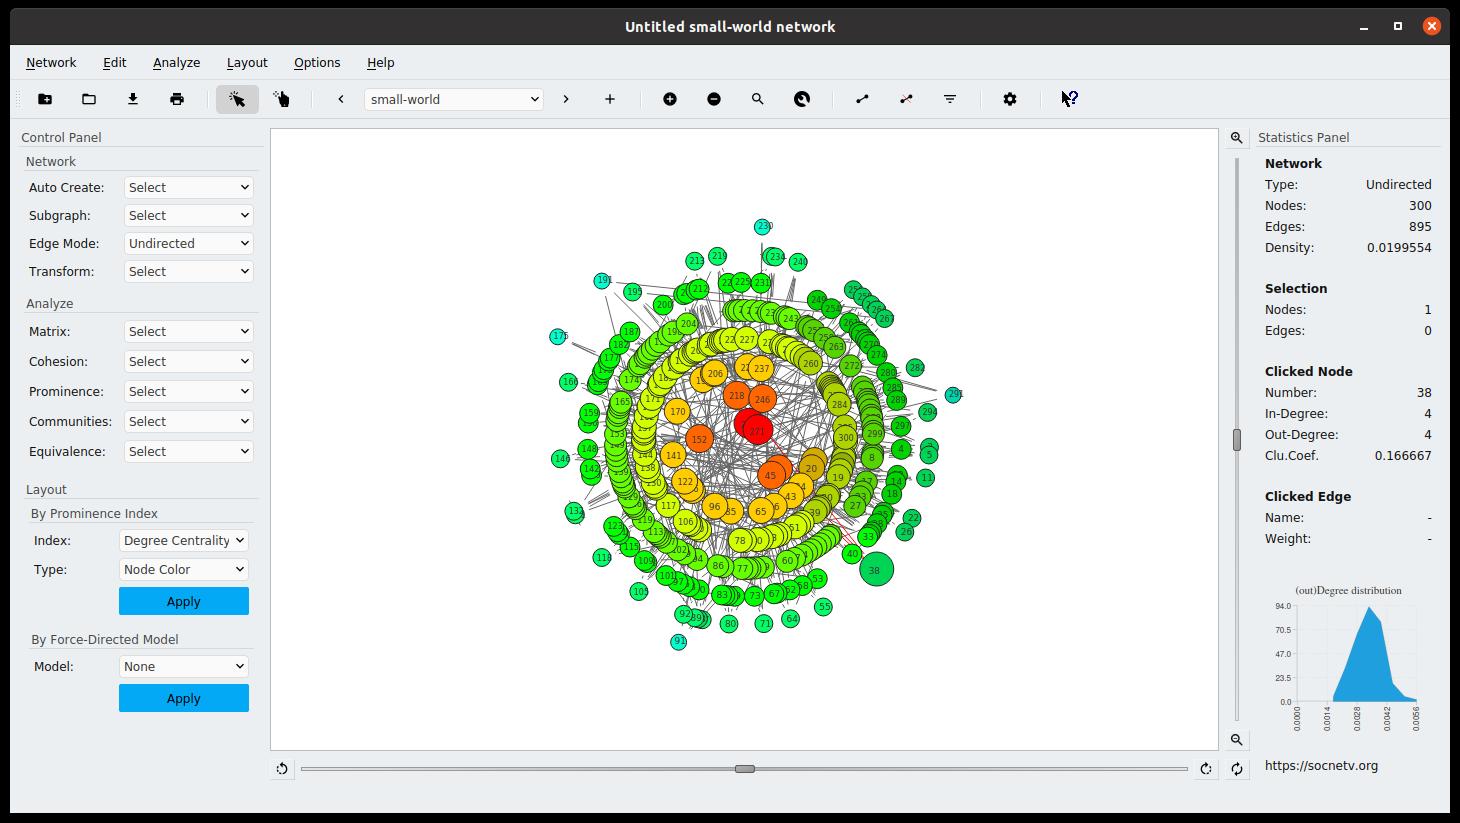
The left toolbox (Control Panel) interface was changed to provide a more organized one-click functionality.

The add/remove buttons for nodes and edges have been removed from the Control Panel. They now appear as toolbar icons, along with icons for node finding and properties, edge filtering  and application Settings.

The Analyze options in the Control Panel were re-organized in Matrix, Cohesion, Prominence,  Communities and Equivalence select popups.
In the Matrix popup list, the user can select which Matrix to compute and view, ie. Adjacency, Cocitation, Laplacian, etc.

The Cohesion popup list includes all basic graph-theory metrics: distances, walks, average distance, clustering coefficient etc.

The Equivalence popup lists all available Structural Equivalence algorithms in SocNetV: HCA, Similarities, Pearson Coefficients, and Tie Profile Dissimilarities.


Other improvements/changes
Select Relation box is now editable. You can change the name of the current relation on the fly.
Also, in case of errors during file importing, the applicaiton informs the user about the line in the file where the errors occurs.
 
Changes in Datasets
  - New dataset: Petersen Graph
  - Transformed Krackhardt: High-tech managers and Zachary Karate club into multirelational datasets

Bugs resolved
  #1645504 Wrong distances in valued/weighted social networks
  #1463087 zero appeal parameter not working in scale free nets
  #1629997 Edges with floating point weights are not saved
  #1632857 creating nodes randomly may position some of them out of canvas
  #1634634 Wrong interpretation of edgedefault graph attribute value
  #1636525 Edge labels are not saved in GraphML when the network is undirected
  #1637890 Cannot read edgelist files where edges are declared by labels (include non-digit characters)
  #1632874 Rubber band selection does not always work
  #1633194 Edge arrows option does not exist in Settings
  #1633225 Deselect All does not deselect last clicked node
  #1622870 Fix large matrix formatting in txt exports
  #1637326 Loading multirelational pajek files leaves the app in "not saved" mode
  #1 Wrong Group Degree Centralization computation (https://github.com/socnetv/app/issues/1)
  #2 Use GitHub as code hosting/repository service (https://github.com/socnetv/app/issues/2)

Important Notices:
Project's new domain: http://socnetv.org
Project's code and files are now hosted in Github. :)

Download and as always: have fun with your social network analysis projects!

<< Go back to the previous page

SocNetV Features

Explore the nice features of SocNetV to make
your social network research real fun!

  • Easy User Interface

    Navigate yourself and use the application either with the mouse or the keyboard.

  • File Formats

    Load and save to GraphML, but you can also import most network file formats (GML, Pajek, UCINET, GraphViz, Adjacency, EdgeList etc).

  • Network analysis

    Compute distances, eccentricity, connectedness, clique census, triad census, and Prominence indices (i.e. eigenvector, betweenness and information centrality, promixity prestige, pagerank and more)

  • Visualization

    Apply intuitive visualization layouts on undirected/directed graphs, based on prominence scores or force-directed models.

  • Famous networks

    Automatically recreate known social network datasets such as Padgett's Families

  • Random networks

    Create random networks using one of the supported models (scale-free, Erdős–Rényi, lattice, small worlds)

  • Web Crawler

    Easily visualize and analyze networks of linked web pages and sites through the built-in web crawler.

  • Multi-relational

    Work with multiple relations concurrently. SocNetV supports loading, editing and saving multirelational social networks.

  • Documentation

    Learn to work with SocNetV and make use of Social Network Analysis methods by reading our Manual

  • Free Software

    SocNetV is Free and Open-Source Software, use it everywhere. Have a feature request? Ask us!

Have fun with Social Network Analysis

Use the buttons to download Social Network Visualizer for your OS or to learn more about Social Network Analysis and Visualization reading the Manual .