SocNetV v2.5 released with lots of new features and new looks!
Description
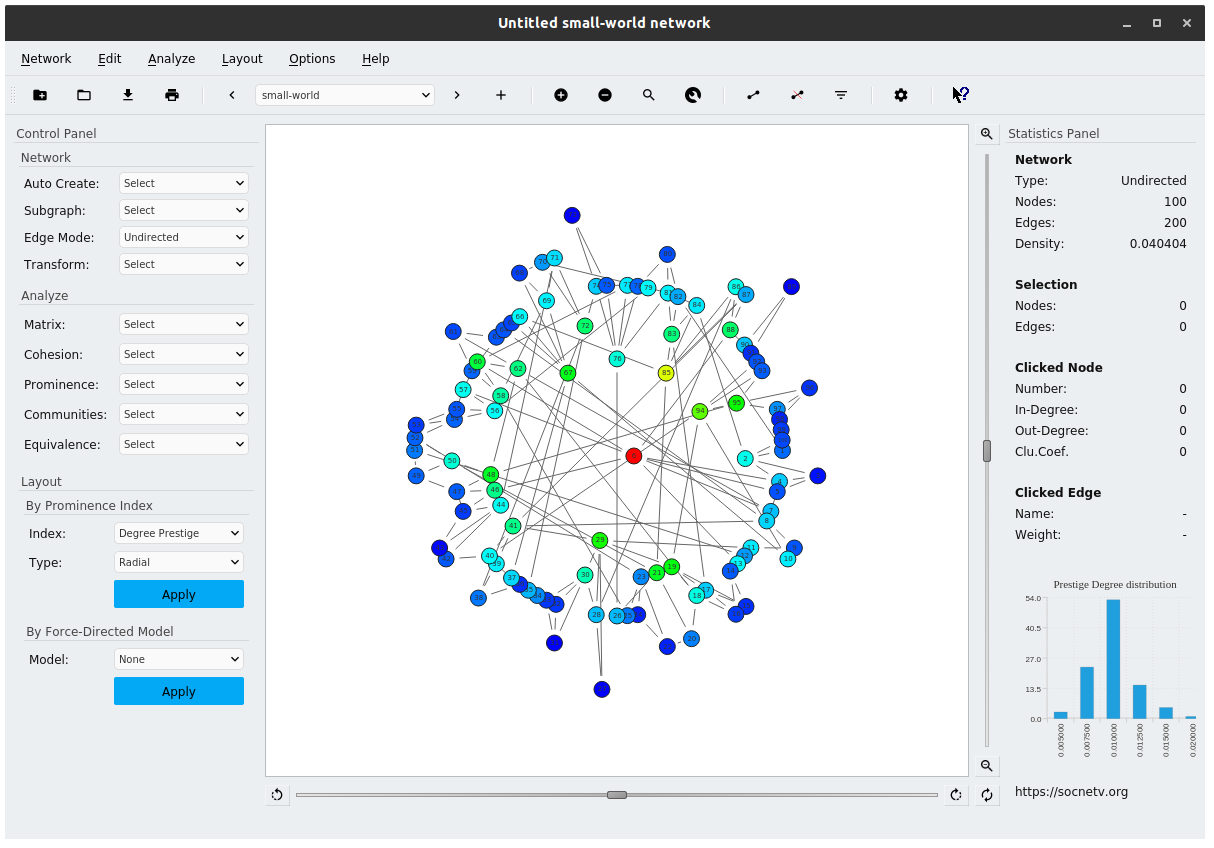
The Social Network Visualizer project has released a brand new version of our favorite social network analysis and visualization software. SocNetV v2.5, codenamed “maniac”, brings new features and improvements and is now available for Windows, macOS, and Linux. Go to the SocNetV Downloads page and get it!
New Features and Improvements
-
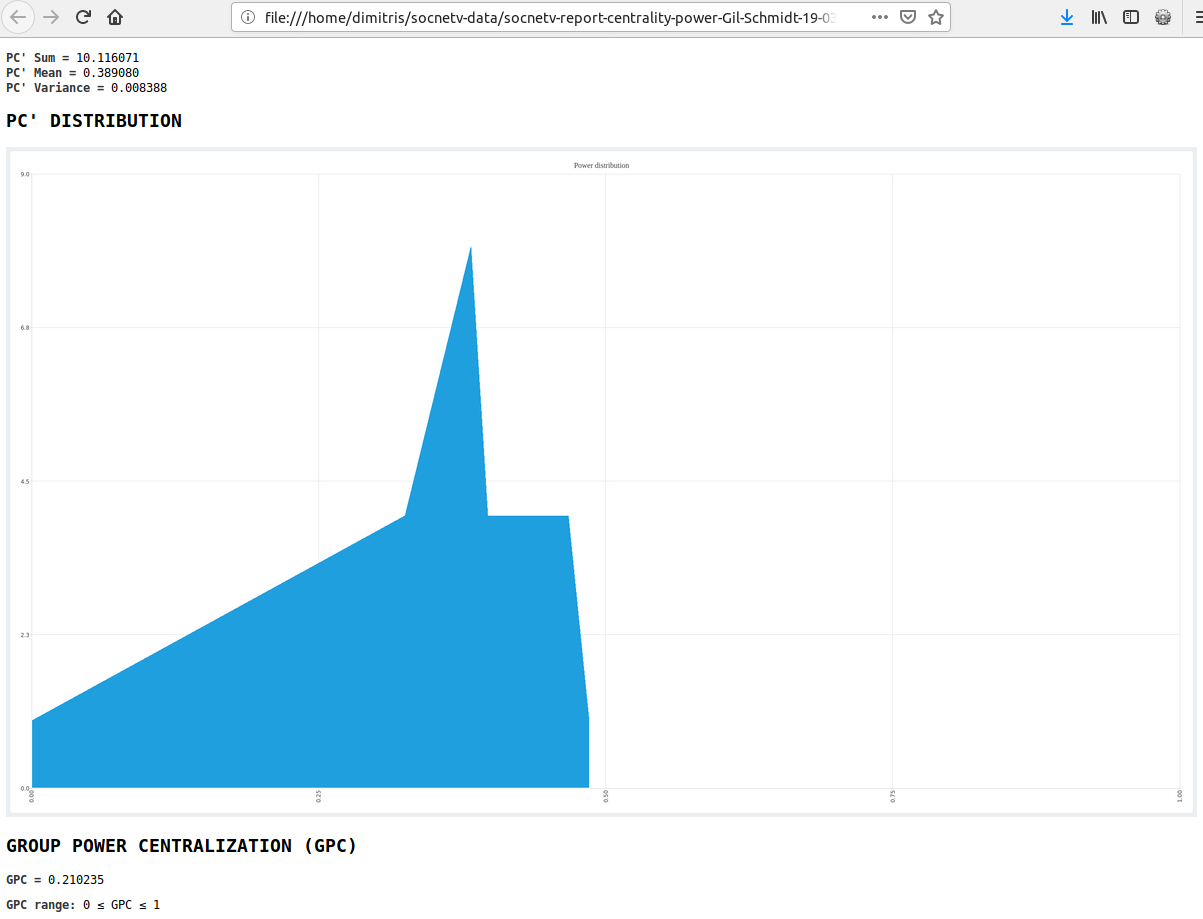
Prominence Score Distribution: SocNetV now automatically computes the prominence scores distribution and displays it in a mini chart in the right sidebar. You can choose the chart type (line, area, or bars) from the app settings. A larger version of this chart is also exported in every HTML prominence report.
-
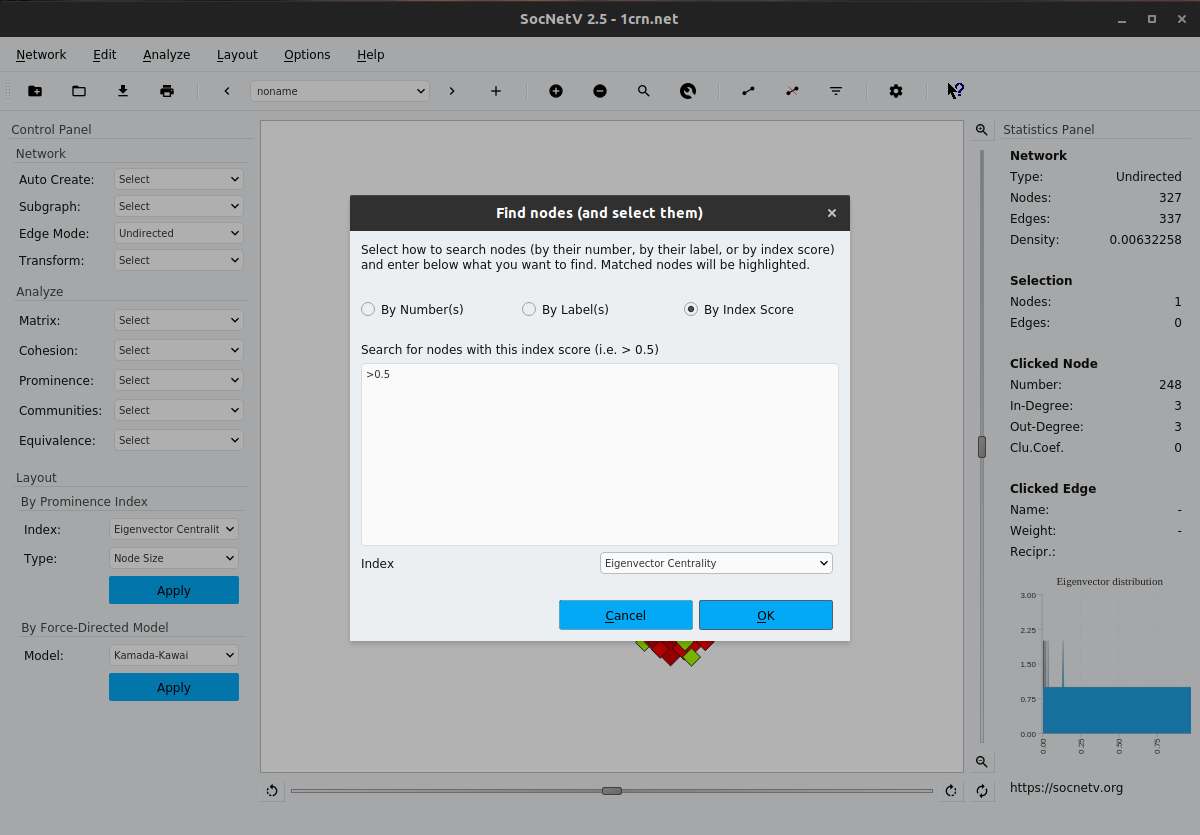
Search for and Select Multiple Nodes by Numbers, Labels, Scores: You can now search for multiple nodes by their number, label, or prominence score. Matched nodes are highlighted.
-
Lattice Network Generator: Create regular lattices of arbitrary dimensions. Define the lattice dimension
dand the length/sizelof each dimension. You can also define a custom neighborhood sizento set the distance within which neighbors on the lattice will be connected.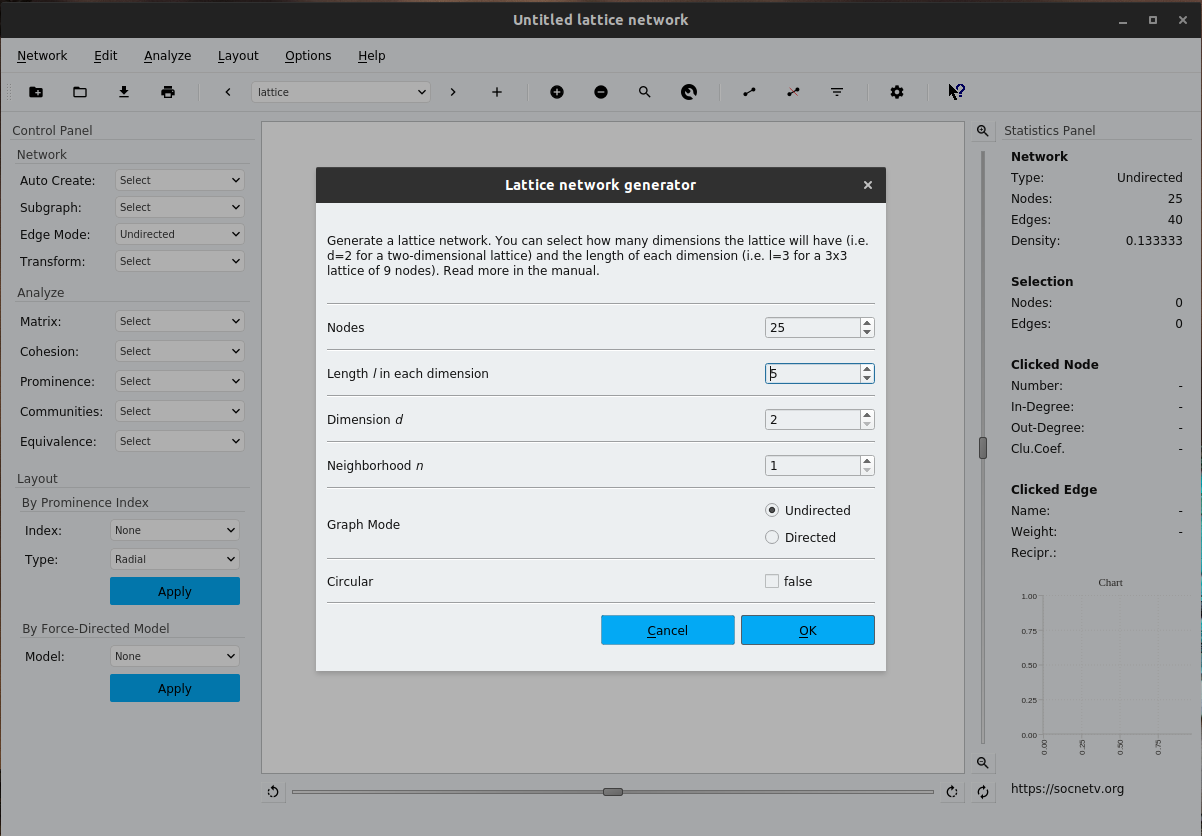
-
Edge Dichotomization: For weighted networks, you can now dichotomize the edges according to a threshold. Edges with weights above the threshold will become binary, converting the network to a non-valued graph displayed in a new relation.
-
Custom Icons in Nodes: SocNetV now allows you to use custom images (e.g., PNG, JPEG, SVG) as node icons. You can choose the desired image from Settings -> Nodes. Any image file from your filesystem can be used as a custom node icon in your network.
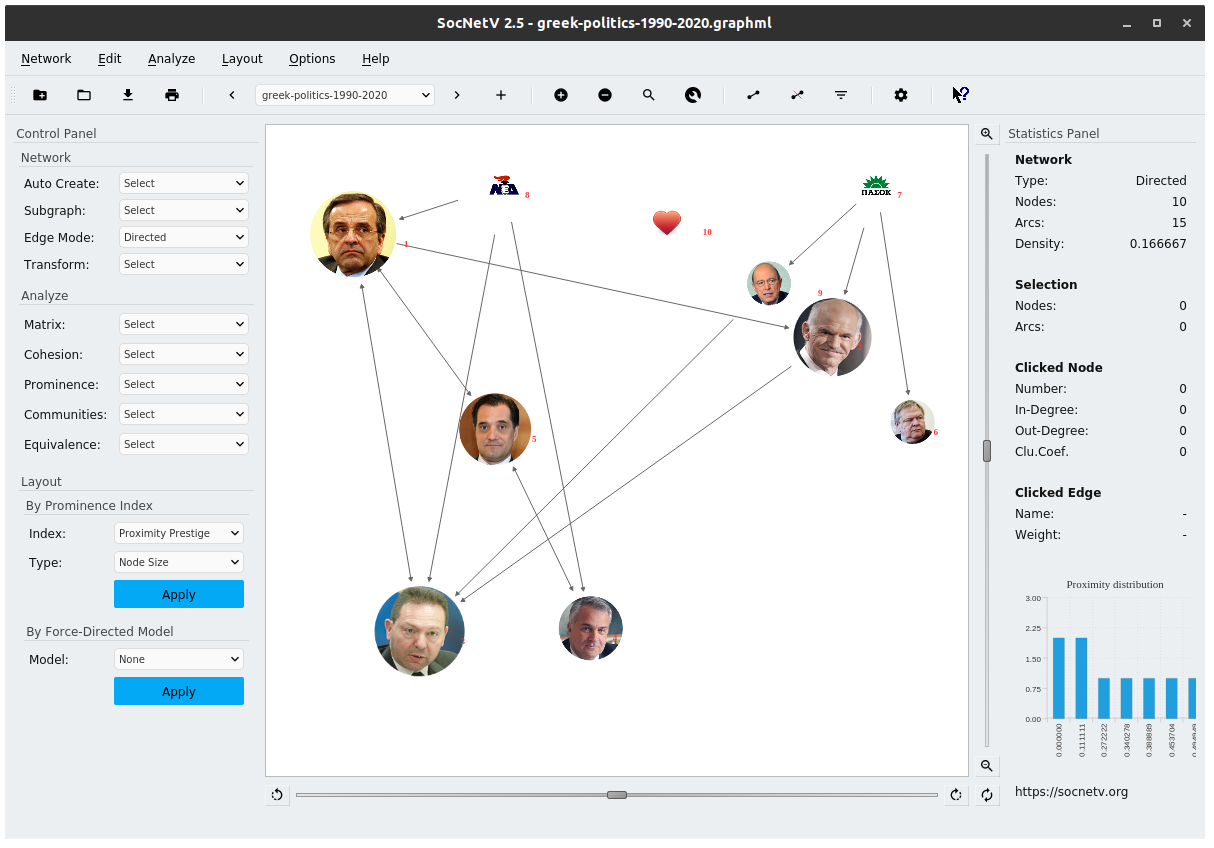
Additionally, SocNetV offers many built-in icons (e.g., person, computer, bug).
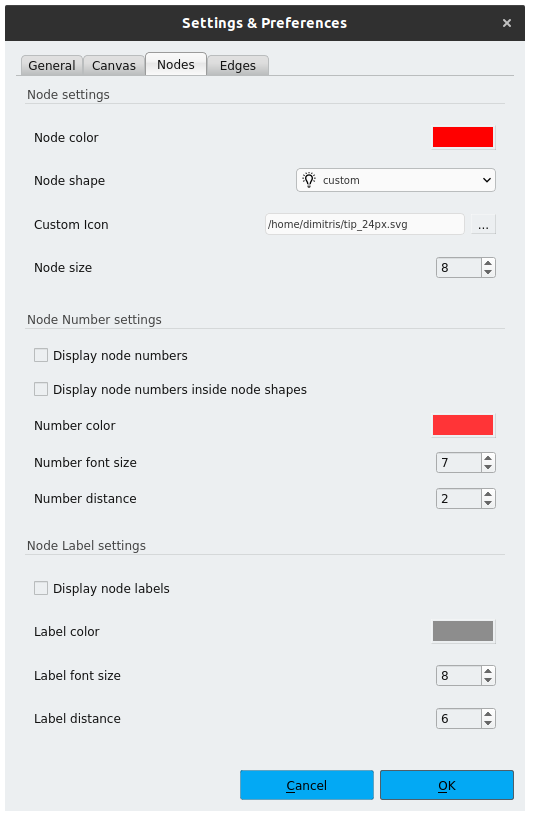
-
Export Network to Any Image Format: Export your network to any image format supported by Qt (e.g., PNG, JPG, BMP, TIFF).
-
Much Improved PDF Exporting: You can now select orientation, quality, and DPI when exporting the network to a PDF file.
-
Uniform UI Theme: A high-quality UI theme inspired by Material Design, providing a uniform look and feel across all operating systems.
-
New Control Panel Toolbox Menu: Network Auto Create: You can now automatically create a network with one click in the new toolbox menu. Random networks, famous datasets, and web crawlers are supported.
-
Improved Web Crawler: The built-in web crawler now runs faster and allows you to exclude/include social network links, parent, and child links.
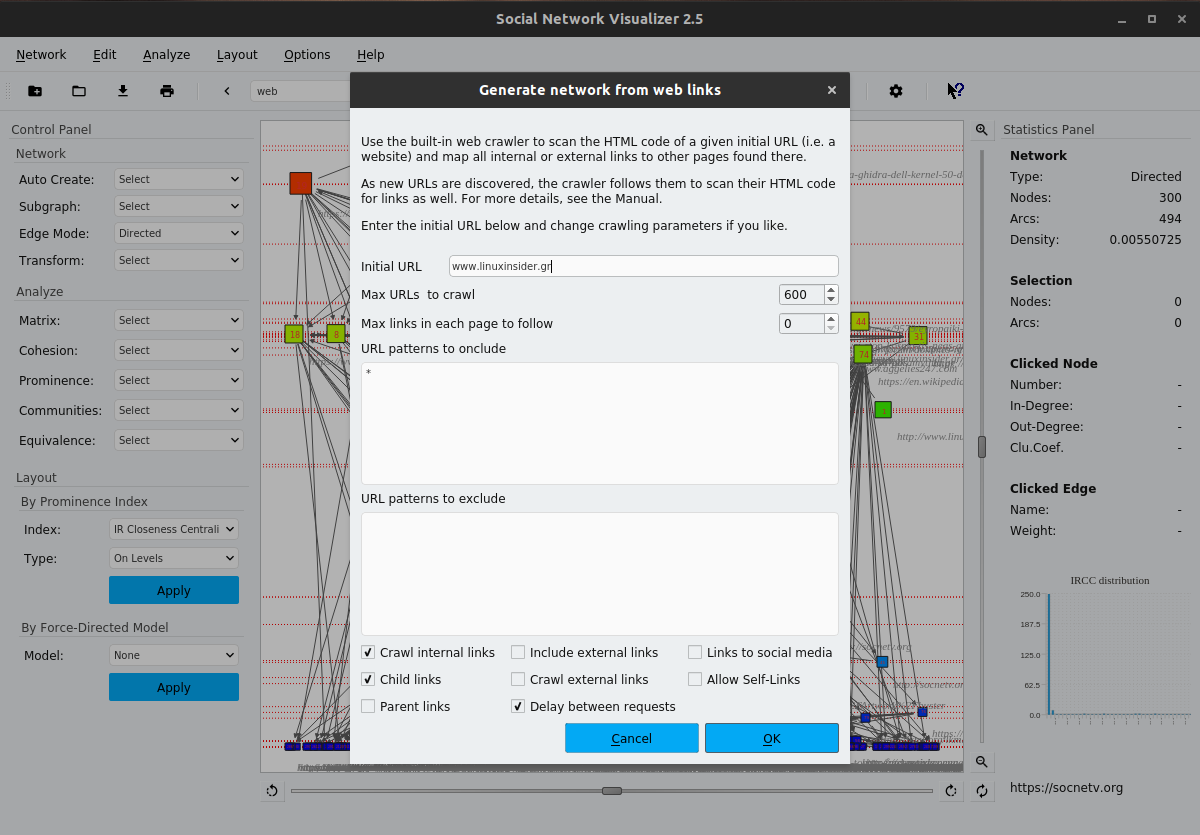
-
Support for Floating Point Edge Weights: SocNetV now supports floating point (double) edge weights in Adjacency, GraphML, Pajek, edge lists, GML, etc. This fixes a bug with non-integer edge weights when importing Adjacency files.
This version also brings speed optimization and improved memory management.
Availability
SocNetV v2.5 is now available for Windows, macOS, and Linux. Go to the SocNetV Downloads page to get it!