Skip to content

release

17 posts with the tag “release”

SocNetV v3.6 Released

SocNetV v3.6 released! 🎉

We are happy to announce the release of SocNetV v3.6!

This release adds a multi-condition Query Builder filter, subgraph extraction, four new export formats (UCINET DL, GraphViz DOT, weighted and simple edge lists), connected-component colouring, Clustering Coefficient node colouring, and working Bezier curve edges. Analysis of large networks is also noticeably faster — read on for details.

🔍 What’s New in SocNetV v3.6?

🔎 Query Builder — multi-condition filtering

A new Filter → Filter by Query… action opens the Query Builder dialog. You can add as many conditions as you like (pick an attribute, an operator, and a value), and only nodes or edges matching all of them will be shown. It works alongside the existing Filter Bar — the result appears as a removable chip, just like any other filter.

✂️ Subgraph Extraction

A new Edit → Subgraphs submenu lets you save a piece of your network as a separate file:

  • Save visible nodes as subgraph… — saves whatever is currently visible on the canvas (after filters) as an independent network file.
  • Save selected nodes as subgraph… — same, but only for selected nodes.

Your original network is never modified.

📤 Four New Export Formats

You can now export your network to four additional formats:

  • UCINET DL — compatible with UCINET and other tools that read the DL format. Multi-relation networks are fully supported.
  • GraphViz DOT — exports node positions, colours, shapes, and custom attributes. You can reload the exported file back into SocNetV and get exactly the same network.
  • Weighted Edge List — a simple text file with one source target weight per line.
  • Simple Edge List — same, without the weights.

The Save Subgraph As… dialog now also offers all these formats (previously it was limited to GraphML, Pajek, and Adjacency).

🎨 Connected-Component Colouring

A new Layout → Node Color by Connected Component action colours each node according to its connected component — nodes in the same component share the same colour. This makes it immediately obvious when your network is split into disconnected parts. The Analyze → Cohesion → Connectedness report now also tells you how many components the network has.

📐 Clustering Coefficient Node Colouring

Layout → Node Color → Clustering Coefficient colours nodes by their local clustering coefficient using the same blue-to-red gradient used by all other centrality measures. It is also available in the Filter Nodes by Centrality dialog and the distribution chart.

〰️ Bezier Curve Edges — now actually working

The Options → Edges → Bezier Curves toggle has been in the menu since v3.4 but never did anything. It is now fully working: edges draw as smooth curves, arrowheads point in the right direction even on reciprocated pairs, and the setting is remembered across sessions.

⚙️ Zero-weight Edge Settings

  • A new Settings → Edges → Show zero-weight edges checkbox (on by default) lets you hide zero-weight edges on load — useful when your data file contains them but you don’t want them cluttering the canvas.
  • The zero-weight edge colour picker in Settings now actually works (it was wired up in the UI but had no effect before).

↔️ Configurable Arrow Size

A new Settings → Edges → Arrow size control lets you make arrowheads bigger or smaller. The change applies immediately to all edges and is remembered for future sessions.


⚡ Faster analysis on large networks

All centrality and distance computations (betweenness, closeness, eccentricity, and others) now use all available CPU cores instead of just one. The numbers below are from our tests on a 12-core Linux machine:

NetworkCentralities computedBeforeAfter
Directed, 500 nodes, 1 219 edgesyes679 ms255 ms
1 000 nodes, 10 000 edgesno28 423 ms3 431 ms
1 000 nodes, 10 000 edgesyes47 020 ms5 949 ms

Large networks (2 000+ nodes, 40 000+ edges) are also smoother to navigate — selecting, dragging, and rubber-band selection no longer slow to a crawl.


🛠 Other Improvements

  • The Layout section of the Control Panel no longer has “Apply” buttons — layout changes take effect as soon as you make a selection.
  • The Statistics Panel on the right is now divided into collapsible sections, so you can hide the parts you don’t need.
  • Node and edge toolbar actions now behave sensibly when multiple items are selected: one item selected opens its properties dialog, multiple selected opens a bulk-edit dialog.
  • The left Control Panel now scrolls when vertical space is tight (e.g. when the Data Table dock is open) instead of overlapping its own widgets.
  • The status bar now shows a “Computing… please wait” message whenever the app is doing something that takes a moment, so you always know it is working.

🐛 Notable Bug Fixes

  • UCINET DL two-mode networks now load correctly (node counts, node numbers, and labels were all wrong before).
  • Galaskiewicz famous network now loads correctly — a missing data file in the app bundle was causing it to silently fail.
  • Edge mode (directed/undirected) now correctly switches back when you change relation — each relation remembers its own setting.
  • Zero-weight edges were being counted in several analyses where they shouldn’t have been (density, reciprocity, clustering coefficient, shortest paths). All fixed.
  • Shift+click on a node now adds it to the current selection instead of replacing it.
  • GraphViz DOT files exported by SocNetV could silently drop the first node when reloaded, producing wrong edges. Fixed.
  • Multi-relation networks where the first relation had no weights but a later one did were incorrectly reported as unweighted throughout the app. Fixed.
  • Several keyboard shortcut conflicts between actions were resolved.

Download SocNetV v3.6 from our Downloads page and let us know what you think!

Happy analyzing!
— The SocNetV Team
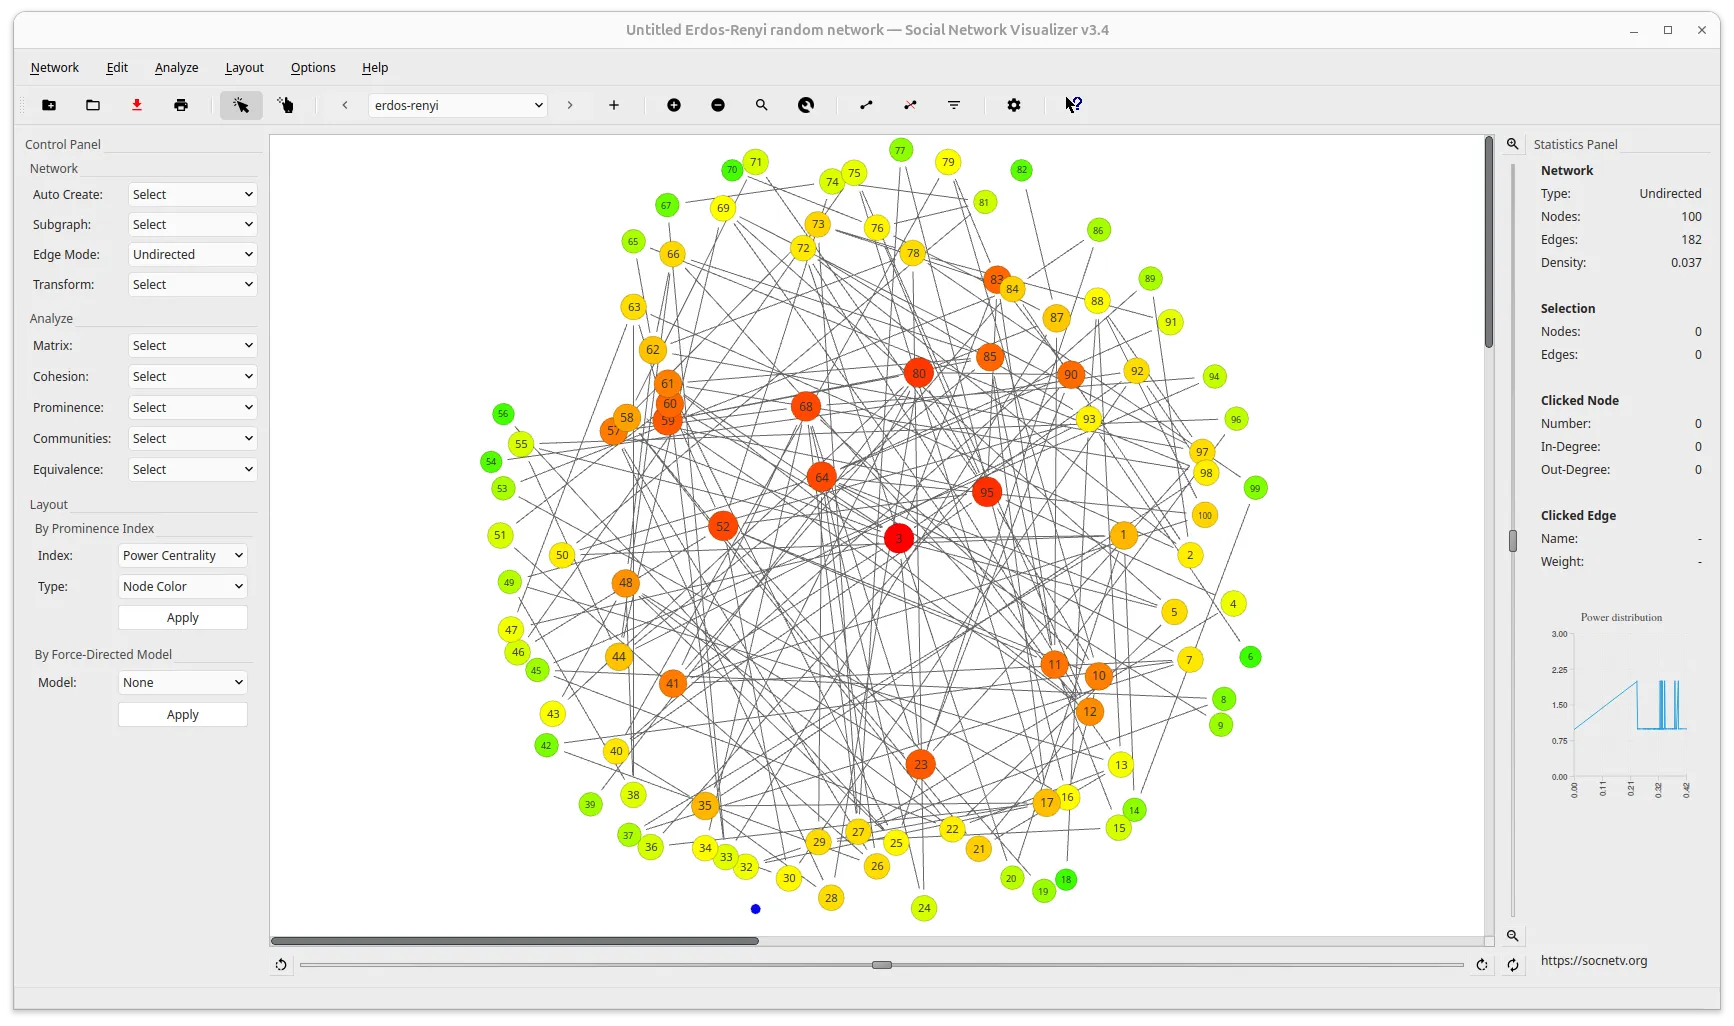
SocNetV v3.5 Released

SocNetV v3.5 released! 🎉

We are excited to announce the release of SocNetV v3.5, the most feature-rich release in the project’s history!

This release introduces graph exploration filters, a new ego-centered radial layout, a complete node/edge attribute system, a live data table dock with inline editing, and structured CSV/JSON export and import — unlocking a full roundtrip workflow between SocNetV and external spreadsheet tools.

🔍 What’s New in SocNetV v3.5?

🔎 Graph Exploration Filters

A new set of non-destructive, snapshot/restore filters lets you focus on the parts of the network that matter:

  • Focus on Node (Ego Network): hides all nodes except the selected node and its direct neighbors, and all non-incident edges. Available in the Filter menu and node right-click context menu.
  • Focus on Selection: hides all nodes not in the current selection and all edges whose endpoints are not both selected (Ctrl+X, Ctrl+S).
  • Restore All Nodes: restores all nodes hidden by any filter (ego network, selection, or centrality). Available in Filter menu and right-click context menu.
  • Restore All Edges: re-enables all edges hidden by the weight filter (Ctrl+E, Ctrl+R).
  • All node-visibility filters share a unified non-destructive snapshot/restore history stack — Restore All works across all filter types.

🌐 Ego-centered Radial Layout

A new layout places a selected node at the canvas center, its 1-hop out-neighbors on an inner ring, and all remaining nodes on an outer ring. Available via the Layout menu (Ctrl+Alt+E) and node right-click context menu.

🏷 Node/Edge Attribute System

SocNetV now supports arbitrary custom attributes on both nodes and edges:

  • Set and remove custom key/value pairs on any node or edge via the Properties dialogs.
  • Edge Properties dialog: edit label, weight, color, and arbitrary custom key/value pairs — accessible from the toolbar and edge right-click context menu.
  • GraphML roundtrip: custom node and edge attributes are fully saved and reloaded when working with GraphML files.
  • Filter Nodes By Attribute: a non-destructive filter available in the Filter menu (Ctrl+X, Ctrl+A) lets you show only nodes matching a key/value condition.

⚙️ Attribute-based Filtering

  • Filter conditions support scope (Nodes, Edges, or Both), key, operator (= > < contains), and value.
  • A dedicated dialog lets you select a scope, pick from existing attribute keys, choose an operator, and enter a value.
  • Edges can also be filtered by attribute, using the same snapshot/restore stack as node filters. Numeric values are compared numerically; text values are compared lexicographically.
  • A filter combo in the Control Panel and a dedicated toolbar filter group give one-click access to all filter actions.

🏷 Filter Bar with Chips

  • A persistent Filter Bar strip sits between the toolbar and canvas; it is hidden when no filter is active and appears automatically when any filter is applied.
  • Each active filter condition is shown as a labelled chip (e.g. Nodes: ego network, Edges: weight filter, Nodes: type = investor).
  • Clicking × on the most recently applied chip removes it and reverts that one filter step.
  • The “Clear all” button removes all active filters in one click.
  • All five filter actions produce chips: centrality, ego network, selection, attribute, and edge weight.

📋 Node/Edge Data Table Dock

  • A new dockable Data Table panel (Ctrl+T, also in Options and Edit menus) with two tabs — Nodes and Edges.
  • Nodes tab: columns for number, label, visibility, shape, size, and color — plus one column per custom attribute key. Label, size, color, and custom attribute cells are inline-editable (double-click).
  • Edges tab: columns for source, target, relation, weight, label, and color — plus custom attributes. Weight, label, color, and custom attribute cells are editable.
  • All edits write back to the graph immediately.
  • Live search bar filters all columns (case-insensitive); column headers are sortable; a Refresh button reloads data from the current graph.
  • The panel auto-refreshes on file load and graph reset when it is open.

📤 Structured CSV/JSON Export

  • Each tab in the Data Table dock has Export CSV and Export JSON buttons — they export the currently visible (search-filtered) rows.
  • Network → Export to other... gains four new actions: Nodes as CSV, Edges as CSV, Nodes as JSON, Edges as JSON — these always export all rows.

📥 Structured CSV/JSON Attribute Import

  • Import node or edge attributes from a CSV or JSON file via the Import buttons in the Data Table dock.
  • A preview dialog shows the first rows of the file and lets you map columns: choose which column holds the node ID (or the source/target for edges).
  • Standard columns (Label, Size, Color for nodes; Weight, Label, Color for edges) are routed to their proper fields; all other columns become custom attributes.
  • The table auto-refreshes after import.
  • Supports a full lossless export→import roundtrip: re-importing an exported file produces no duplicate columns and no data loss.

📊 Spreadsheet-based Bulk Attribute Editing

Export the data table to CSV or JSON, edit it freely in any spreadsheet tool (Excel, LibreOffice, Google Sheets), and re-import to update attributes in bulk. Each node or edge can carry different values — unlike in-app bulk operations which assign one value to many.

⚡ Improvements

  • Fruchterman-Reingold layout: significantly faster on large graphs thanks to pre-cached adjacency lookups, better initial placement, and early convergence detection.
  • Kamada-Kawai layout: particles that drift out of bounds are now clamped to the canvas instead of being teleported randomly.

🐛 Bug Fixes

  • Fixed Kamada-Kawai crash when node filters are active.
  • Fixed crash on graph reset when an edge had already been removed.
  • Fixed filter history stack not being cleared on graph clear / application reset.
  • Fixed custom node attribute key/id mismatch in GraphML export.
  • Fixed Pajek parser: use default node shape as fallback when no Pajek shape keyword is present.
  • Fixed hierarchical clustering dialog signal/slot mismatch.
  • Fixed Node Properties dialog UX issues for custom attributes.
  • Fixed triad census appending stale zeros on repeated runs.

We’d like to thank our contributors and users for reporting issues, testing fixes, and helping SocNetV improve with every release. 🙏

Download SocNetV v3.5 from our Download page and let us know what you think!

Happy analyzing!
— The SocNetV Team
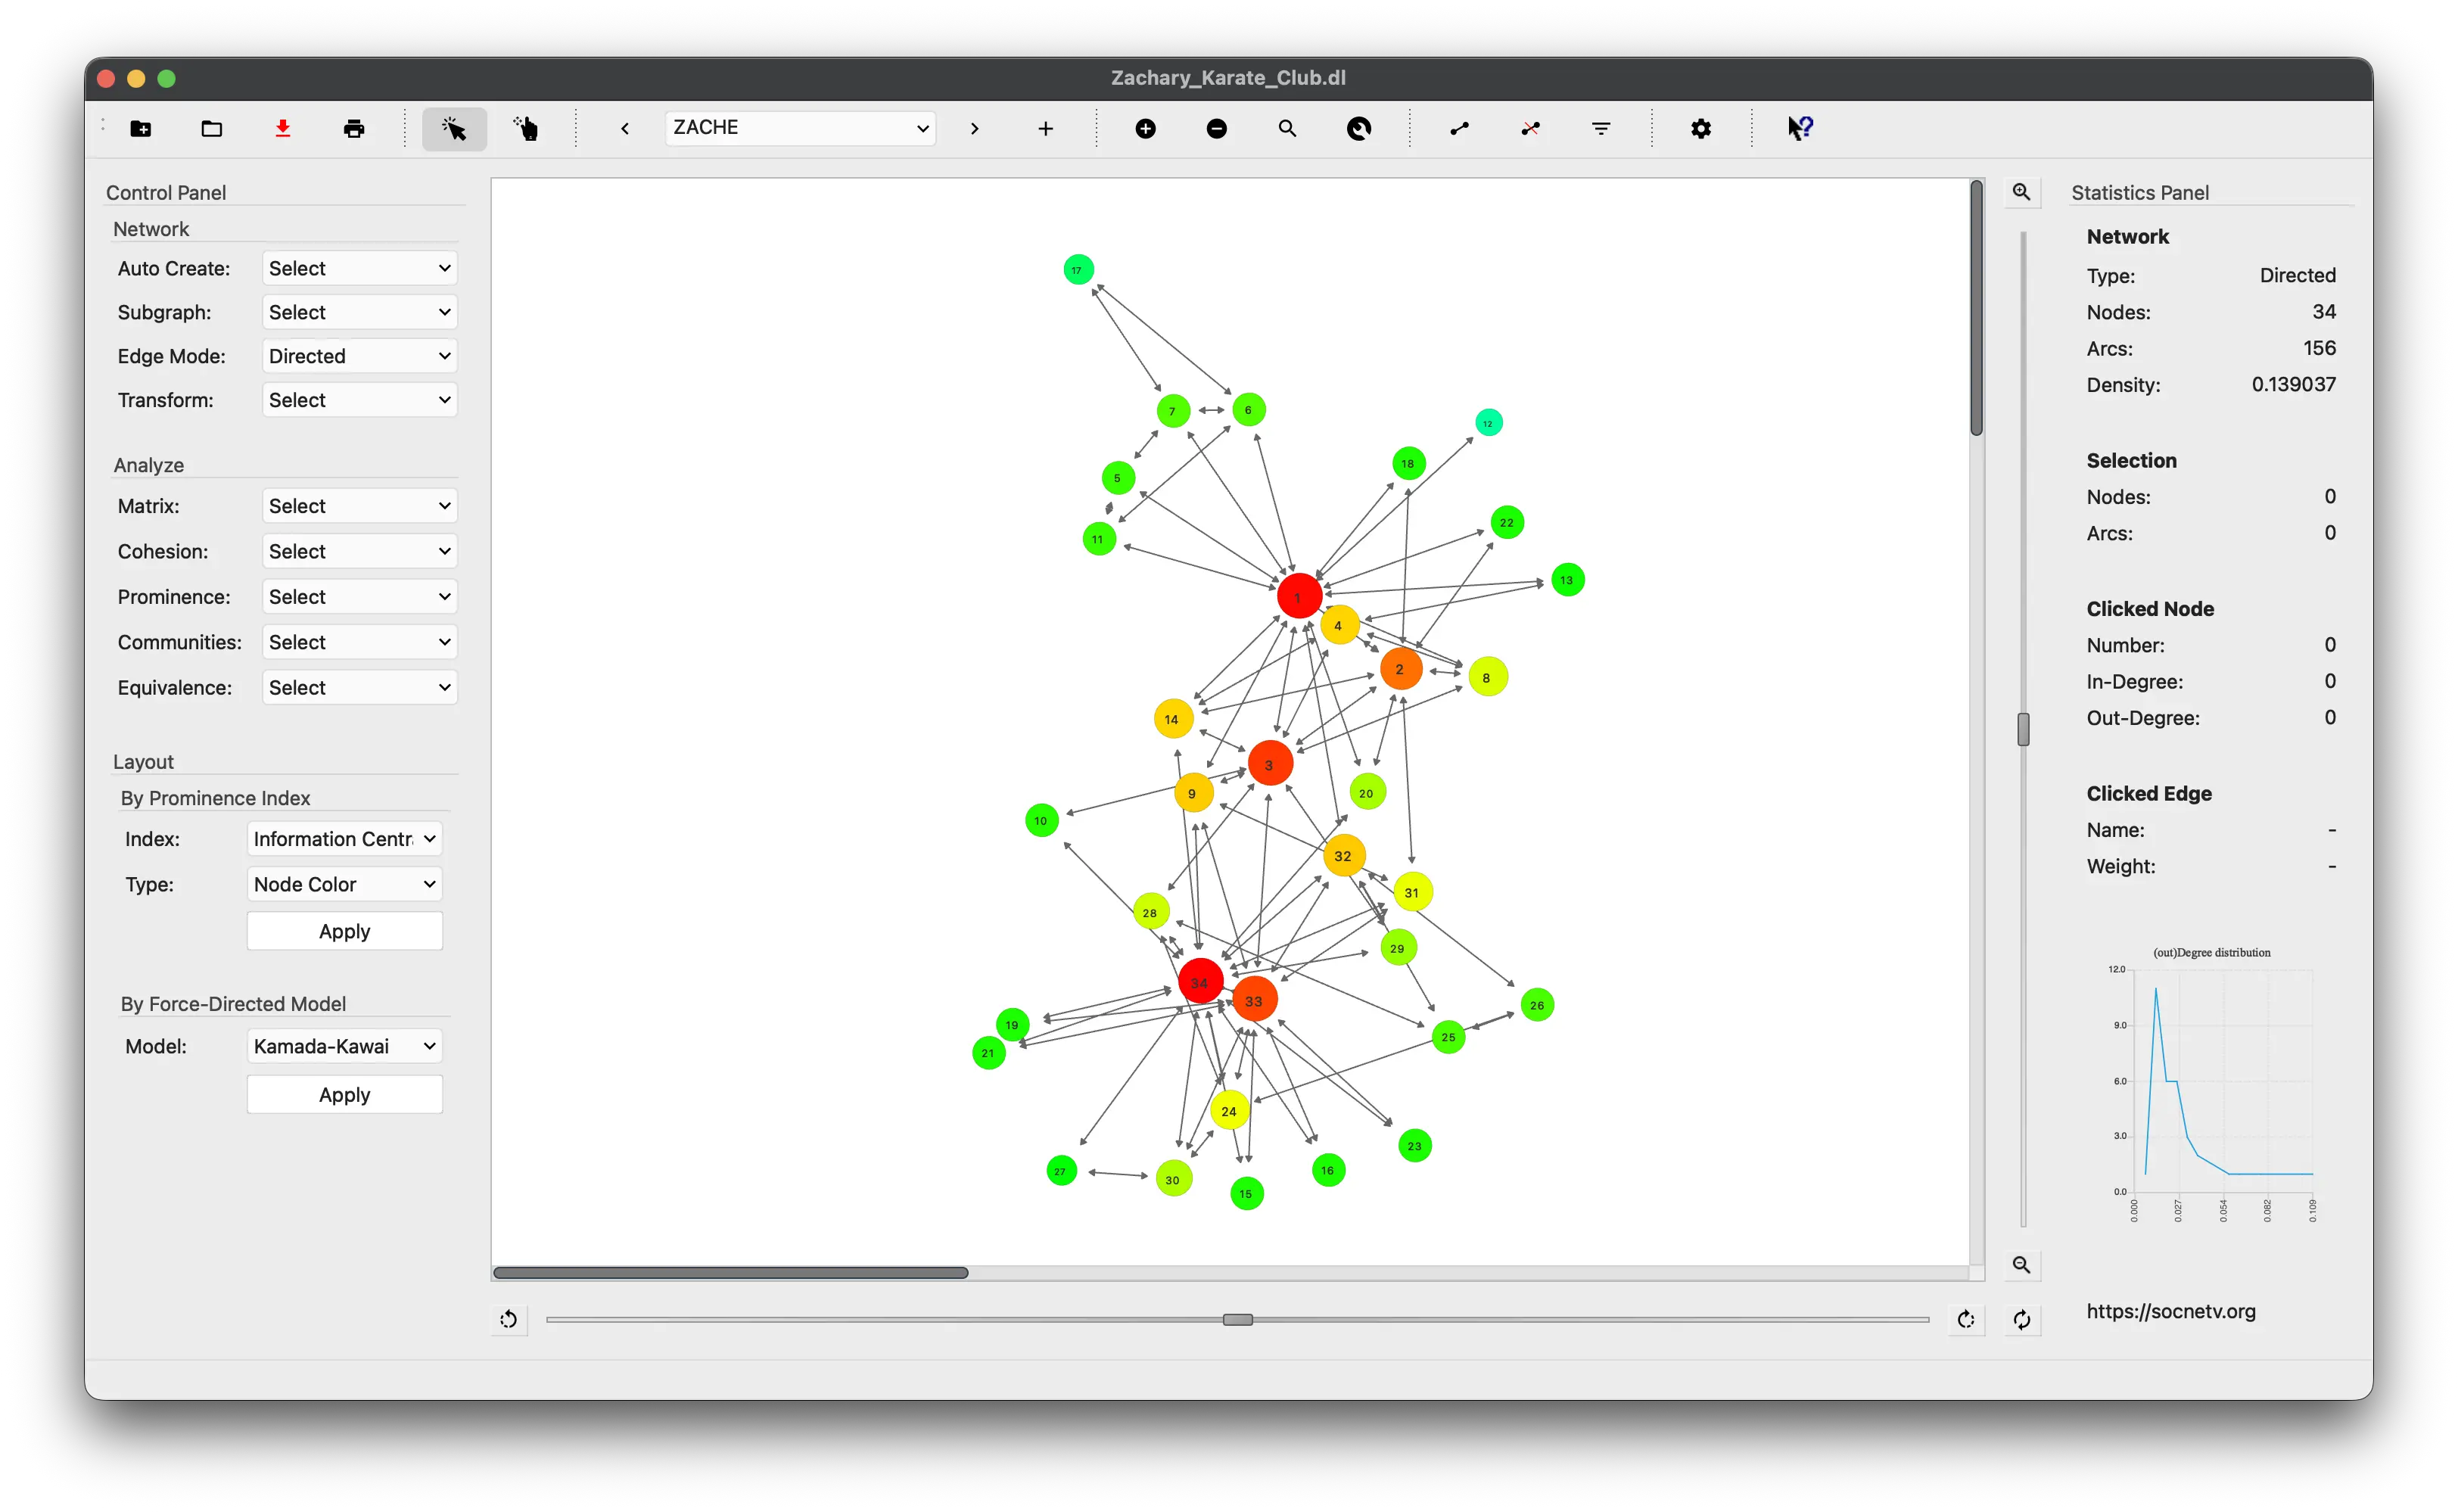
SocNetV v3.4 Released

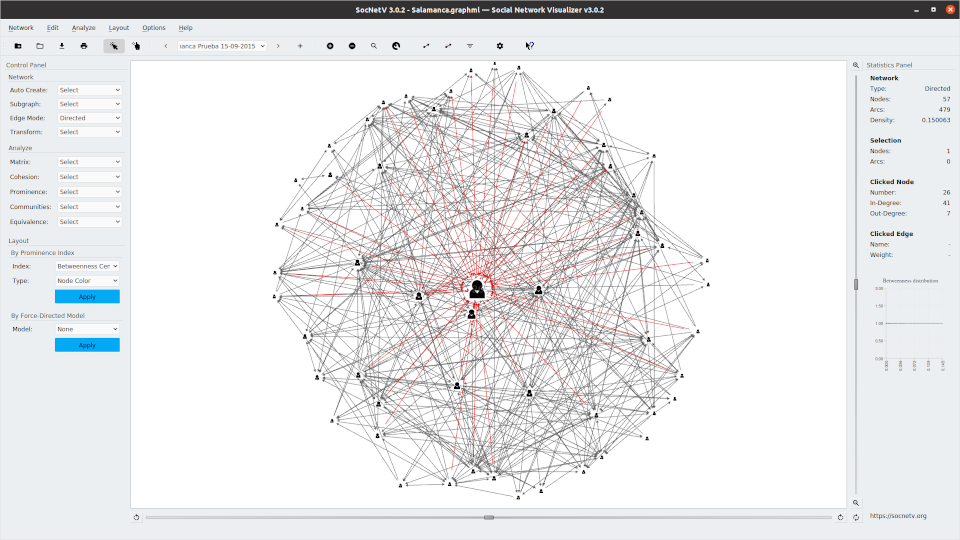
SocNetV v3.4 Screenshot

SocNetV v3.4 released! 🎉

We are happy to announce the release of SocNetV v3.4, the latest version of our cross-platform social network analysis and visualization software.

This release focuses on stability and correctness, with a comprehensive overhaul of progress/cancel handling across all computation paths, significant parser and layout fixes, and the completion of the IO/Parser architectural refactor started in v3.3.

🔍 What’s New in SocNetV v3.4?

⏹ Comprehensive Cancel support in progress dialogs (#52)

This has been one of the longest-standing issues in SocNetV. In v3.4, the Cancel button in progress dialogs now works correctly and consistently across all computation paths:

  • Centrality and prestige computations
  • Reachability and walks
  • Matrix and report generation
  • Layout algorithms (including Kamada-Kawai)
  • Clique census and subgraph construction
  • All random network generators (Erdős–Rényi, Small-World, Scale-Free, Regular, Lattice, Ring-Lattice)

📐 Force-directed layout fixes

  • Fixed division-by-zero, NaN/Inf, and logic errors in the Kamada-Kawai layout (#198)
  • Fixed Fruchterman-Reingold simmering temperature derivation from canvas size (#199)
  • Faithful reimplementation of the Eades (1984) Spring Embedder (#207)
  • Batched node position emissions in all force-directed layouts for smoother rendering (#205, #206)

📥 Parser and IO fixes

Many import/export edge cases resolved:

  • Pajek *Matrix header parsing for relation labels (#188)
  • Pajek multirelational export as *Matrix blocks (#184)
  • Normalized quoted relation names in Pajek headers (#185)
  • Inline GML node/edge block parsing (#186)
  • Arc doubling when loading undirected DOT graphs (#187)
  • Platform-dependent weighted=true from uninitialized variable in DOT parser (#189)
  • Two-mode sociomatrix import now correctly handled in the parser (#15)

📊 Centrality fixes

  • Fixed eigenvector centrality isolate reset and N==0 handling (#202)
  • Fixed Information Centrality isolate handling and degenerate cases (#201)
  • Fixed clustering coefficient computation for directed networks (#58)
  • Fixed wrong weighted flag when switching relations (#82)

🏗 Completed IO/Parser refactor (WS4)

The architectural refactor of the IO/Parser layer, started in v3.3, is now complete:

  • The monolithic parser.cpp (~5500 LOC) has been split into focused per-format modules: edgelist, adjacency, UCINET DL, DOT, GML, Pajek, GraphML
  • An explicit IGraphParseSink mutation surface replaces the old Qt signal fan-out
  • GUI and headless (socnetv-cli) loading paths now share an identical, deterministic mutation pipeline

🧪 Expanded regression harness

  • New io_roundtrip kernel (schema v5) for IO/parser regression protection
  • Many new golden comparison cases and small deterministic test networks
  • New helper scripts: run_io_roundtrip_shipped_datasets.sh, run_golden_io_roundtrip.sh

🌐 i18n

  • Added update_translations.sh script for maintainers
  • Updated DE and ES translation files

🛠 Build and packaging

  • Debian packaging switched to CMake build system
  • RPM spec updated for CMake (Fedora, openSUSE, Mageia)
  • CMake now generates .qm translation files via qt_add_lrelease

We’d like to thank our contributors and users for reporting issues, testing fixes, and helping SocNetV improve with every release. 🙏

Download SocNetV v3.4 from our Download page and let us know what you think!

Happy analyzing!
— The SocNetV Team
SocNetV v3.3 Released

SocNetV v3.3 Screenshot

SocNetV v3.3 released! 🎉

We are excited to announce the release of SocNetV v3.3, the latest version of our cross-platform social network analysis and visualization software.

This release focuses on robustness and long-term maintainability, with major improvements under the hood — while also adding a useful new feature for researchers working with centrality and prestige.

🔍 What’s New in SocNetV v3.3?

🧱 Major internal refactor: Graph is now a façade SocNetV’s Graph has been refactored into a façade/coordinator, with functionality split into focused modules under src/graph/*.
This makes the codebase easier to extend and safer to evolve without breaking behavior.

📏 DistanceEngine stabilized + deterministic regression guardrails We extracted and stabilized DistanceEngine, and added:

  • deterministic “golden” regression outputs
  • performance benchmark guardrails to help keep refactors honest over time

🧪 New headless regression harness: SocNetV v3.3 introduces socnetv-cli, a modular regression harness designed to protect algorithmic correctness during refactors. It supports schema-versioned JSON outputs and committed baselines, with kernels for:

  • distance (v1)
  • reachability (v2)
  • walks matrix (v3)
  • prominence (v4)

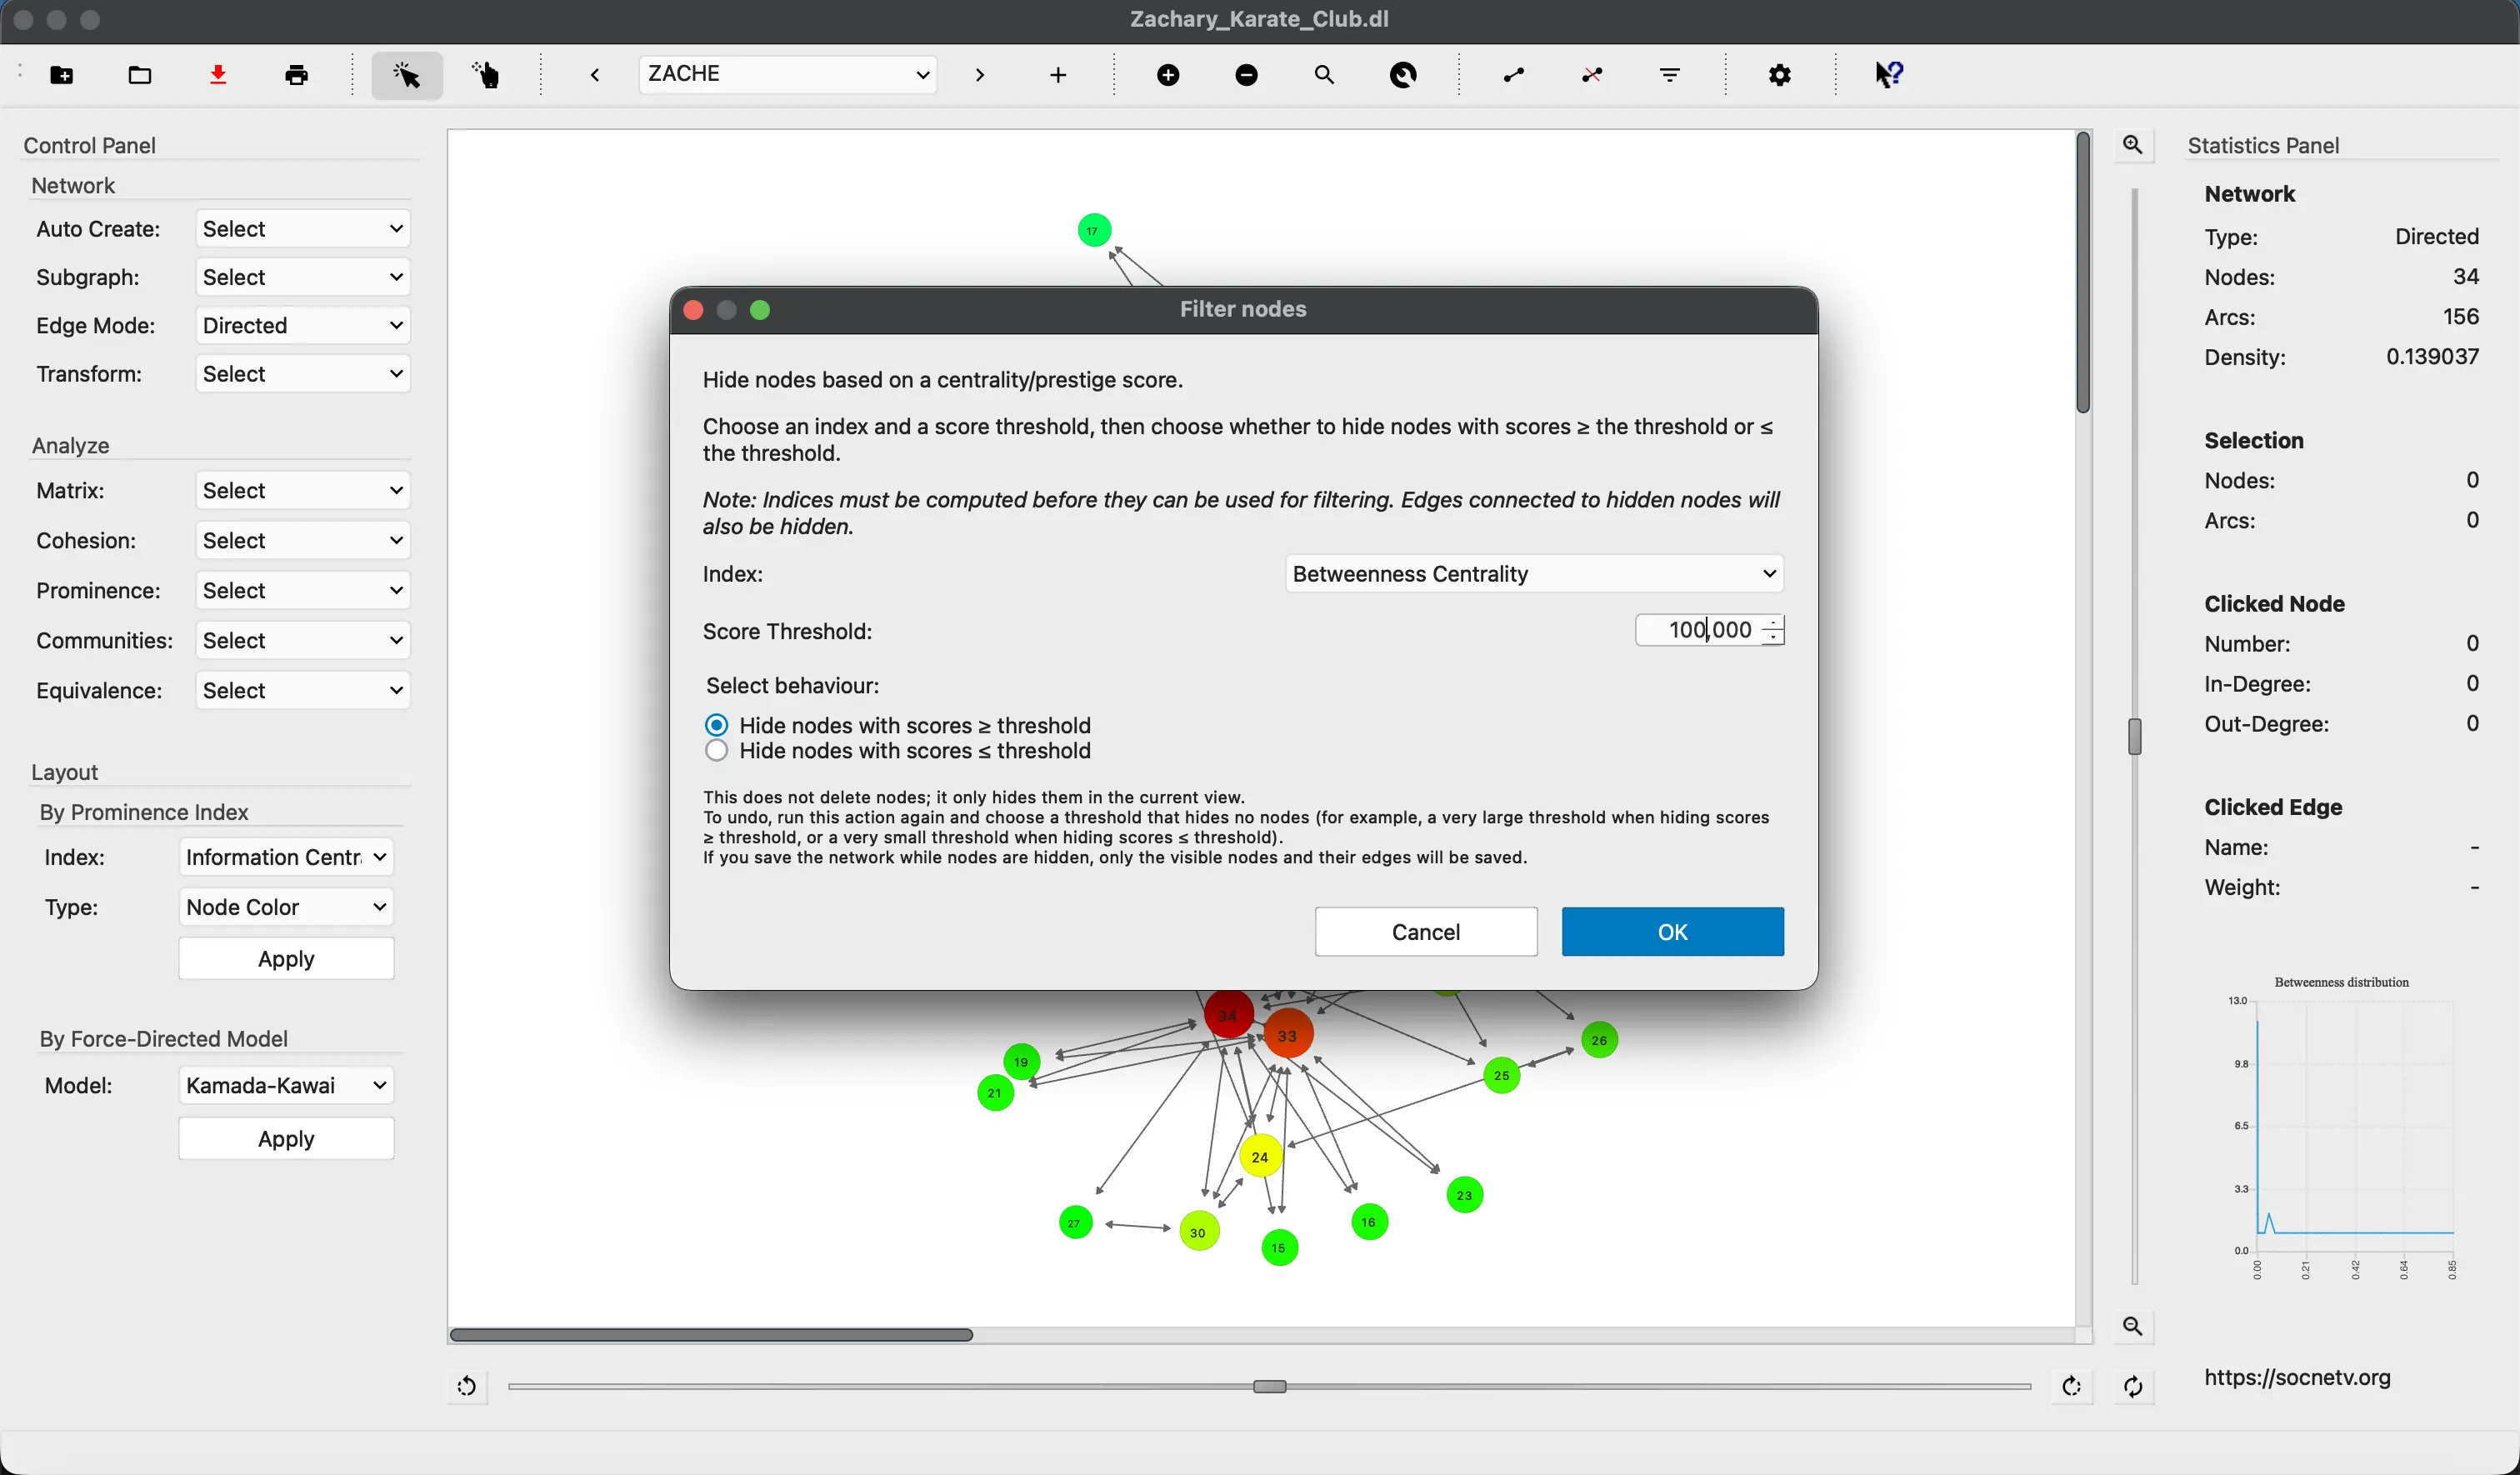
🎯 New feature: filter vertices by centrality & prestige indices You can now filter vertices based on their centrality and prestige scores — a great way to focus analysis on the most important actors in your networks.

filter vertices by centrality

📥 Import / parsing fixes A lot of edge cases were fixed to make importing more reliable:

  • Pajek mixed files with overlapping *Arcs/*Edges blocks
  • UCINET/DL edge cases (line wrapping, diagonal handling)

🧮 Walks computation fixes Fixes in walksBetween() and walks-matrix parameters improve correctness and consistency of walk-based measures.

🛠 Build, packaging, and UI polish

  • cross-platform build & packaging fixes (Qt6/CMake, Debian packaging updates, openSUSE spec fixes, macOS arm64 linker fix)
  • UI polish for disabled widgets and checkbox/radio styling

We’d like to thank our contributors and users for reporting issues, suggesting features, and helping SocNetV improve with every release. 🙏

Download SocNetV v3.3 from our Download page and let us know what you think!

Happy analyzing!
— The SocNetV Team
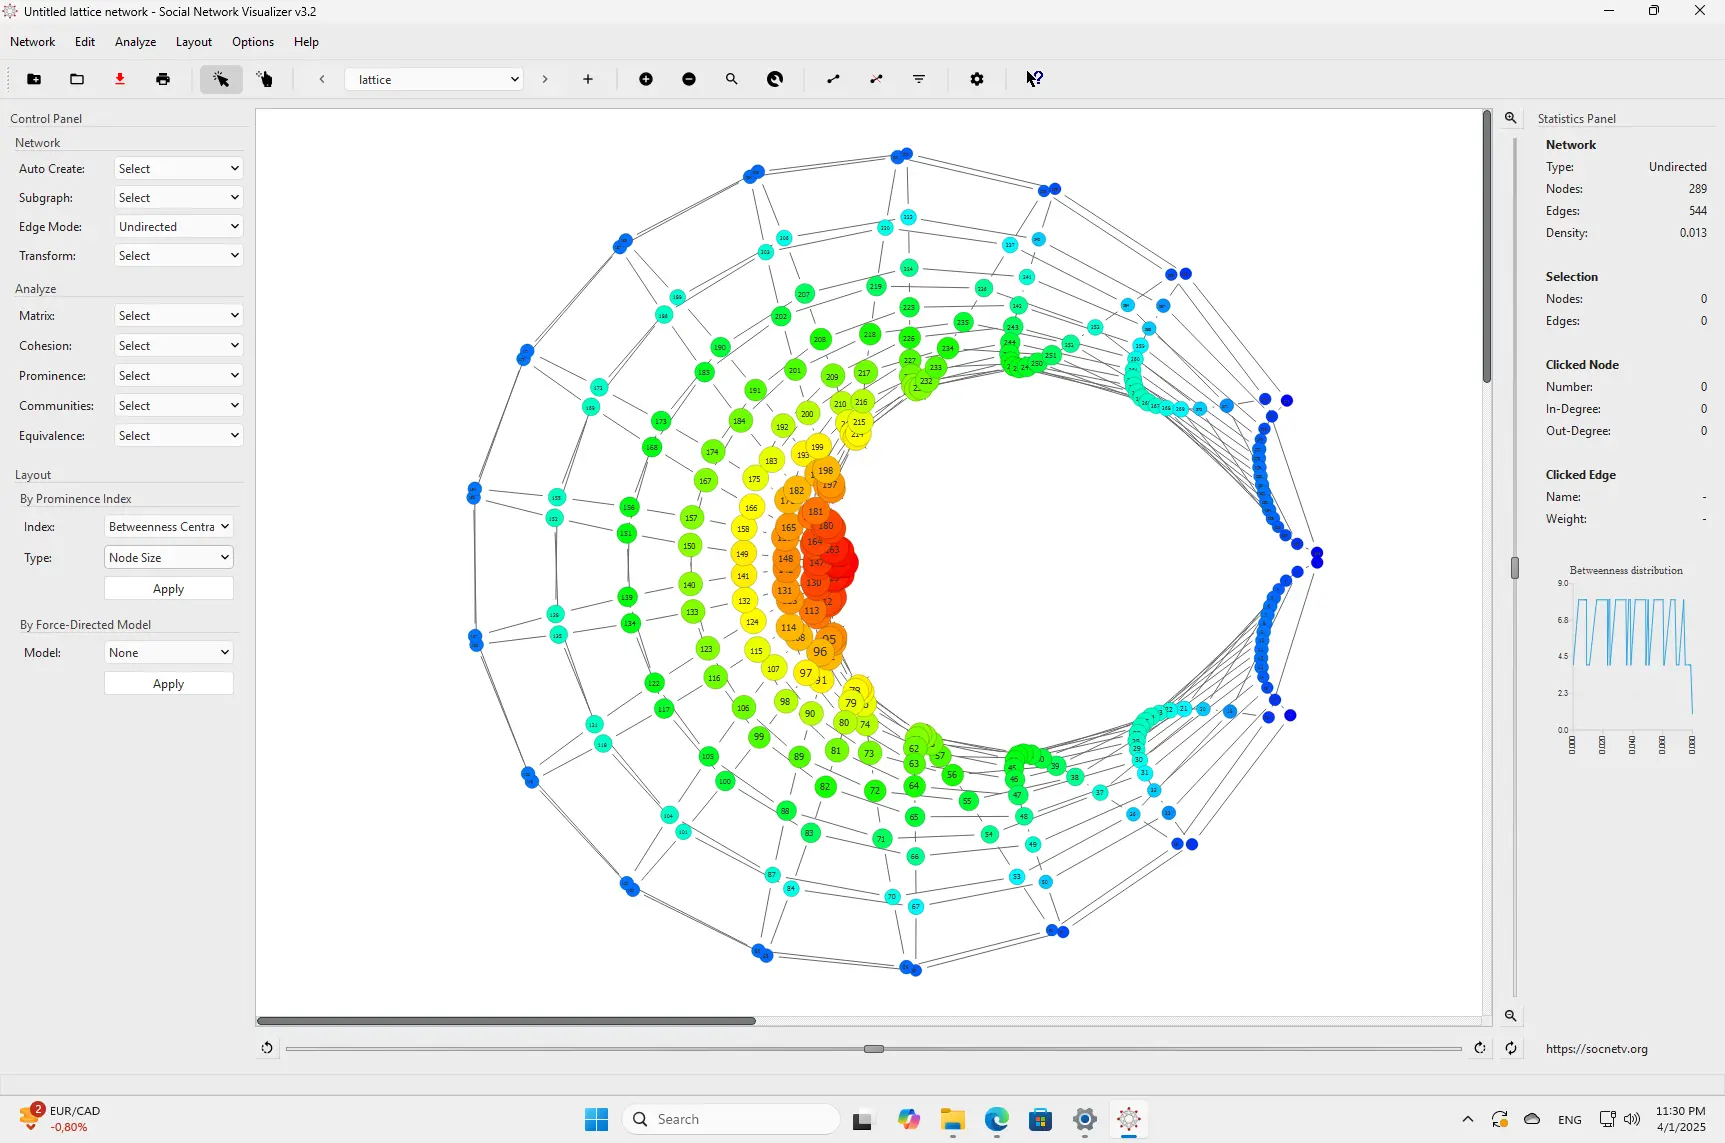
SocNetV v3.2 Released

SocNetV v3.2 Screenshot

SocNetV v3.2 released! 🎉

We are excited to announce the release of SocNetV v3.2, the latest version of our cross-platform social network analysis and visualization software.

This new release introduces some powerful features and important improvements aimed at enhancing your research workflows and making network modeling even easier.

🔍 What’s New in SocNetV v3.2?

🧩 Custom node attributes (metadata)
You can now define and manage custom metadata for nodes directly through the Node Properties dialog. This allows for a more flexible and descriptive representation of your network data — great for researchers who want to attach additional information to each actor.

📊 Node labels in adjacency matrix files
SocNetV v3.2 introduces support for node labels when reading adjacency matrix-formatted files. That means better interoperability with external tools and datasets, and no more guessing who node “3” is supposed to be.

🔧 A modernized build system
We’ve moved to a CMake-based build system, which simplifies compilation and packaging across platforms. Whether you’re building from source on Linux, macOS, or Windows, the process is now more standard and maintainable.

🎯 Updated Filter Edges by Weight
The Filter Edges by Weight functionality has been revamped for improved usability and consistency. It’s now easier to focus on the strongest (or weakest) connections in your networks.

🐛 Tons of bug fixes
From UI tweaks to core algorithm improvements, v3.2 resolves numerous bugs reported by our users. You can explore the full list of closed issues in the GitHub milestone.


We’d like to thank our contributors and users for reporting issues, suggesting features, and helping us improve SocNetV with every release. 🙏

Download SocNetV v3.2 from our Download page and let us know what you think!

Happy analyzing!
— The SocNetV Team
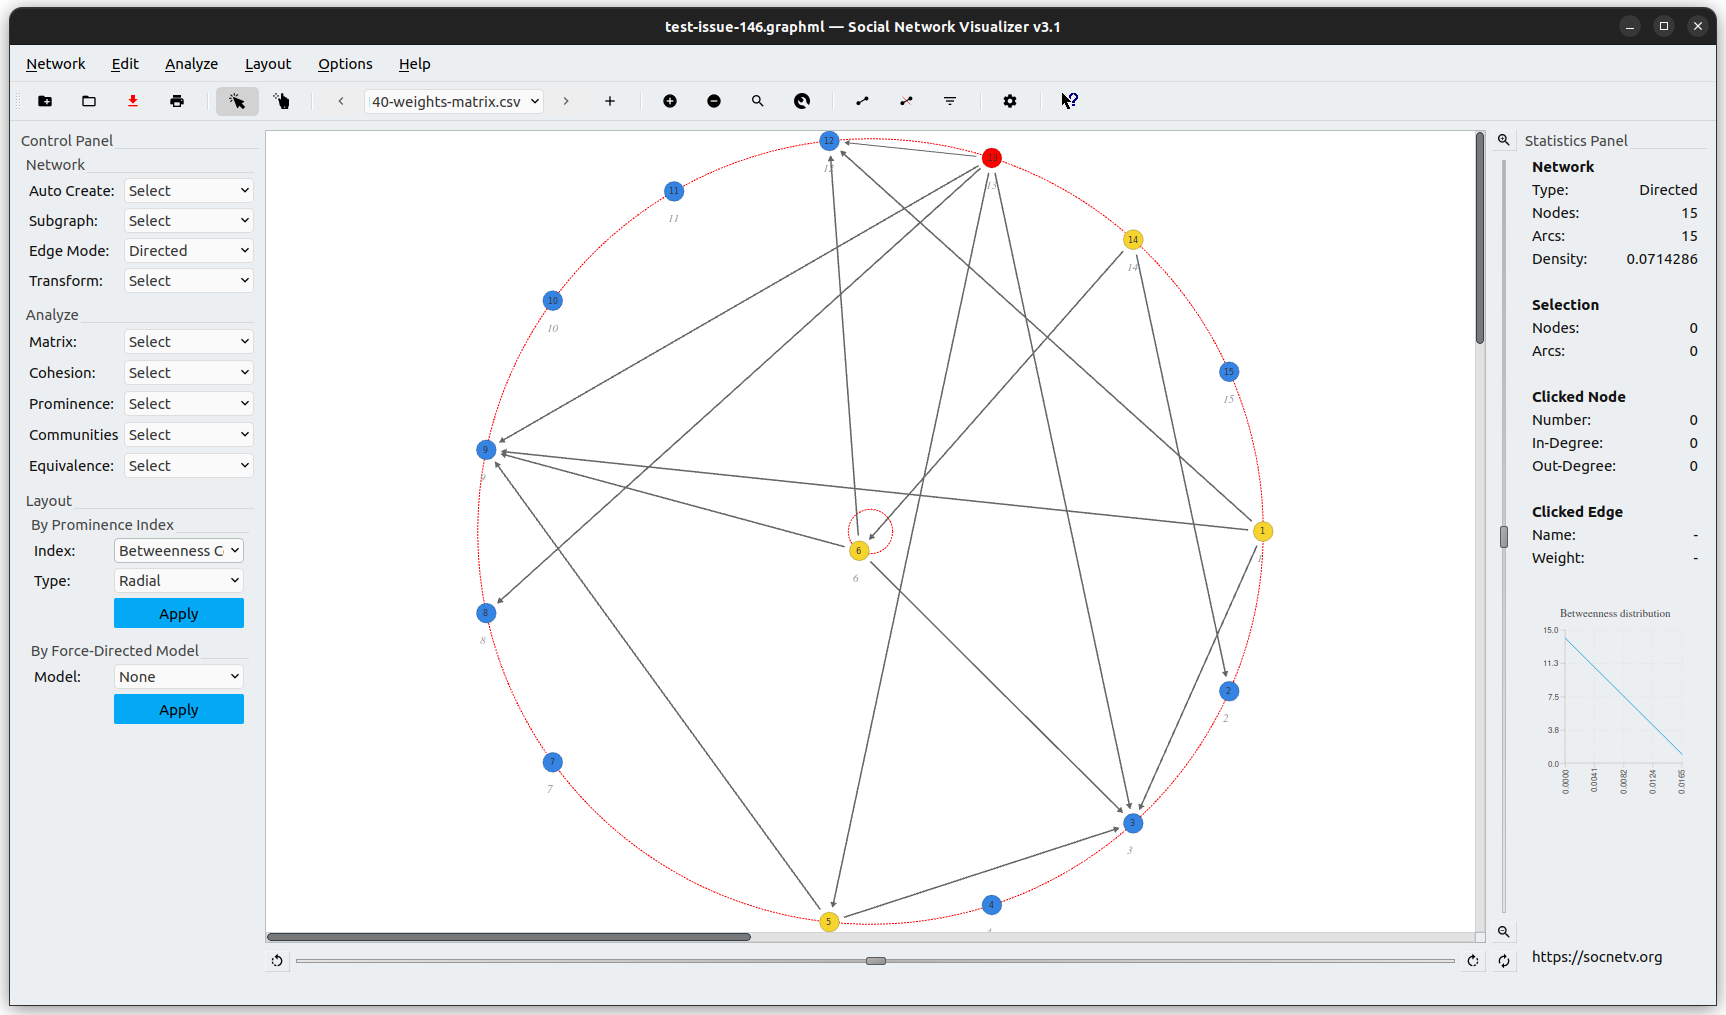
SocNetV v3.1 Released

SocNetV v3.1 Screenshot

Description

The Social Network Visualizer project announces a new version of our favorite SNA application. SocNetV v3.1 is the first Qt6-only release and brings many improvements and bug fixes.

What’s New in v3.1

  • Improved Performance: Faster large file loading and quicker responsiveness with large nets (greater than 20,000 edges), while having a reduced memory footprint.
  • Bug Fixes: Edge filtering now works as intended.

Availability

The new version is available for Windows, macOS, and Linux. Go to the SocNetV Downloads page to get it.

SocNetV v3.0 Released

SocNetV v3.0 is out now! It includes several performance improvements and new features to make social network analysis easier.

SocNetV v3.0 Screenshot

Description

The Social Network Visualizer project has released a brand-new version of our favorite SNA application. SocNetV v3.0 brings improved speed and responsiveness, bug fixes, and new command line parameters.

What’s New in v3.0

  • Improved Performance: Faster computations, as the Graph now runs on a separate thread.
  • Hardware-Accelerated Rendering: This version is the first to support hardware-accelerated (OpenGL) rendering of the networks on the canvas. This feature is enabled by default but can be disabled in Settings.
  • Web Crawler Enhancements: The Web Crawler has been improved to test for OpenSSL support in the OS, with user hints provided if OpenSSL is missing. Additionally, the delay between requests has been fixed.
  • Bug Fixes: A critical bug in weighted network centrality computations has been resolved (see #123).

Special Note

To run SocNetV v3.0 AppImage on Fedora 34 (which uses Wayland by default), use the following command:

env GDK_BACKEND=x11 ./SocNetV-3.0-dev-x86_64.AppImage

For Fedora/openSUSE users, you can get a proper package from our OBS repos.

Availability

The new version is available for Windows, macOS, and Linux. Go to the SocNetV Downloads page to get it.

SocNetV v2.9 Released

SocNetV v2.9 Screenshot

Description

The Social Network Visualizer project has released a new version of our favorite social network analysis and visualization software application. SocNetV v2.9 fixes the macOS Big Sur issue and brings a few bug fixes and improvements.

Availability

SocNetV v2.9 is now available for Windows, macOS, and Linux. Go to the SocNetV Downloads page to get it!

SocNetV v2.8 Released

SocNetV v2.8 Screenshot

Description

The Social Network Visualizer project has released a brand new version of our favorite social network analysis and visualization software application. SocNetV v2.8 brings bug fixes and improvements.

Availability

SocNetV v2.8 is now available for Windows, macOS, and Linux. Go to the SocNetV Downloads page to get it!

SocNetV v2.5 released with lots of new features and new looks!

SocNetV v2.5 Screenshot

Description

The Social Network Visualizer project has released a brand new version of our favorite social network analysis and visualization software. SocNetV v2.5, codenamed “maniac”, brings new features and improvements and is now available for Windows, macOS, and Linux. Go to the SocNetV Downloads page and get it!

New Features and Improvements

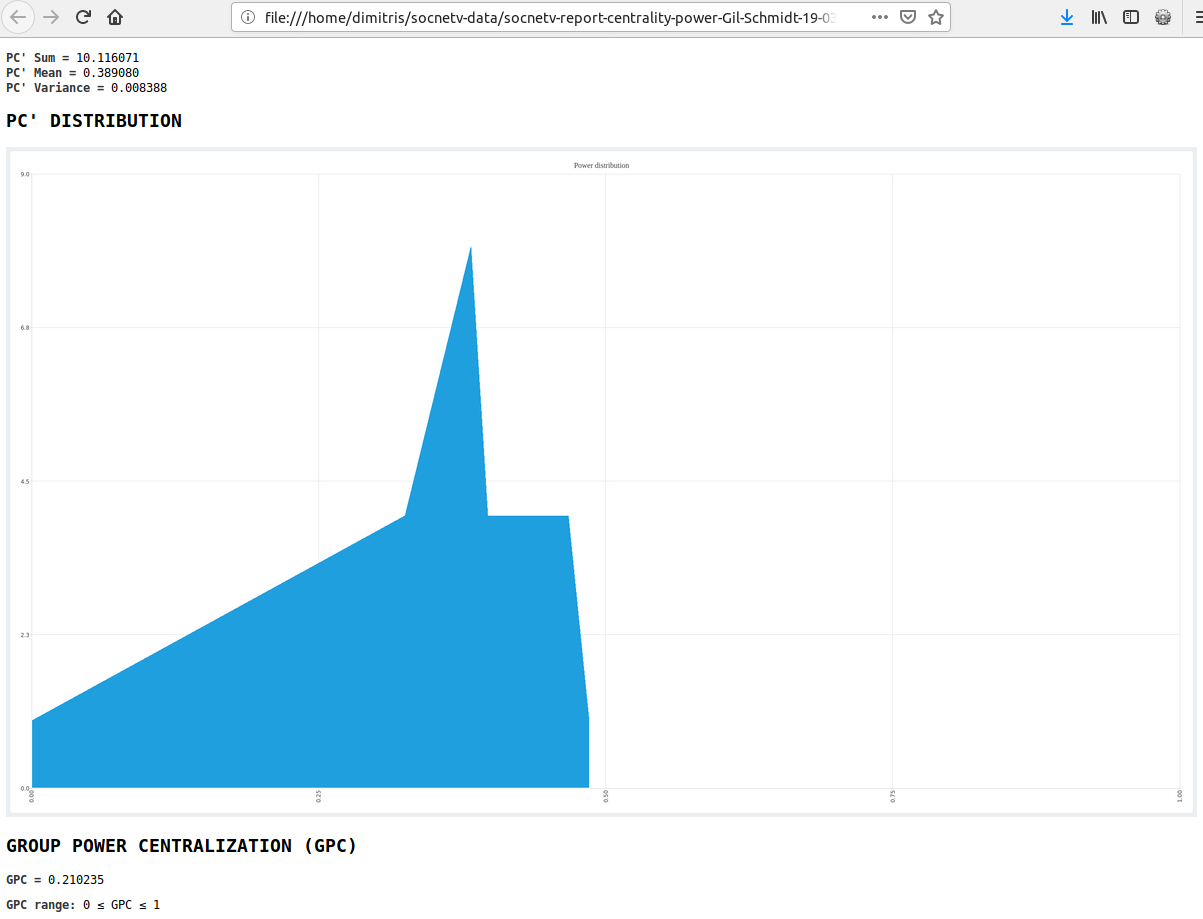
  • Prominence Score Distribution: SocNetV now automatically computes the prominence scores distribution and displays it in a mini chart in the right sidebar. You can choose the chart type (line, area, or bars) from the app settings. A larger version of this chart is also exported in every HTML prominence report.

    Prominence Distribution

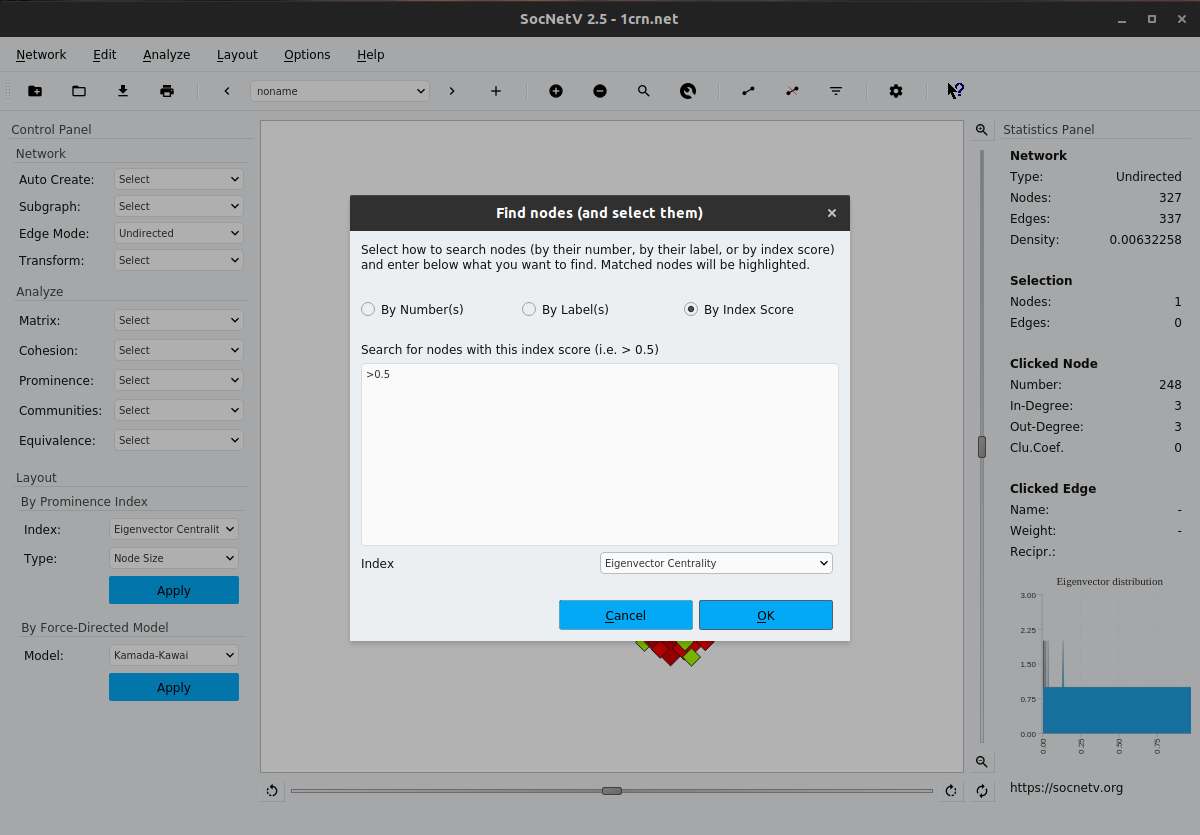
  • Search for and Select Multiple Nodes by Numbers, Labels, Scores: You can now search for multiple nodes by their number, label, or prominence score. Matched nodes are highlighted.

    Search Nodes by Prominence Score

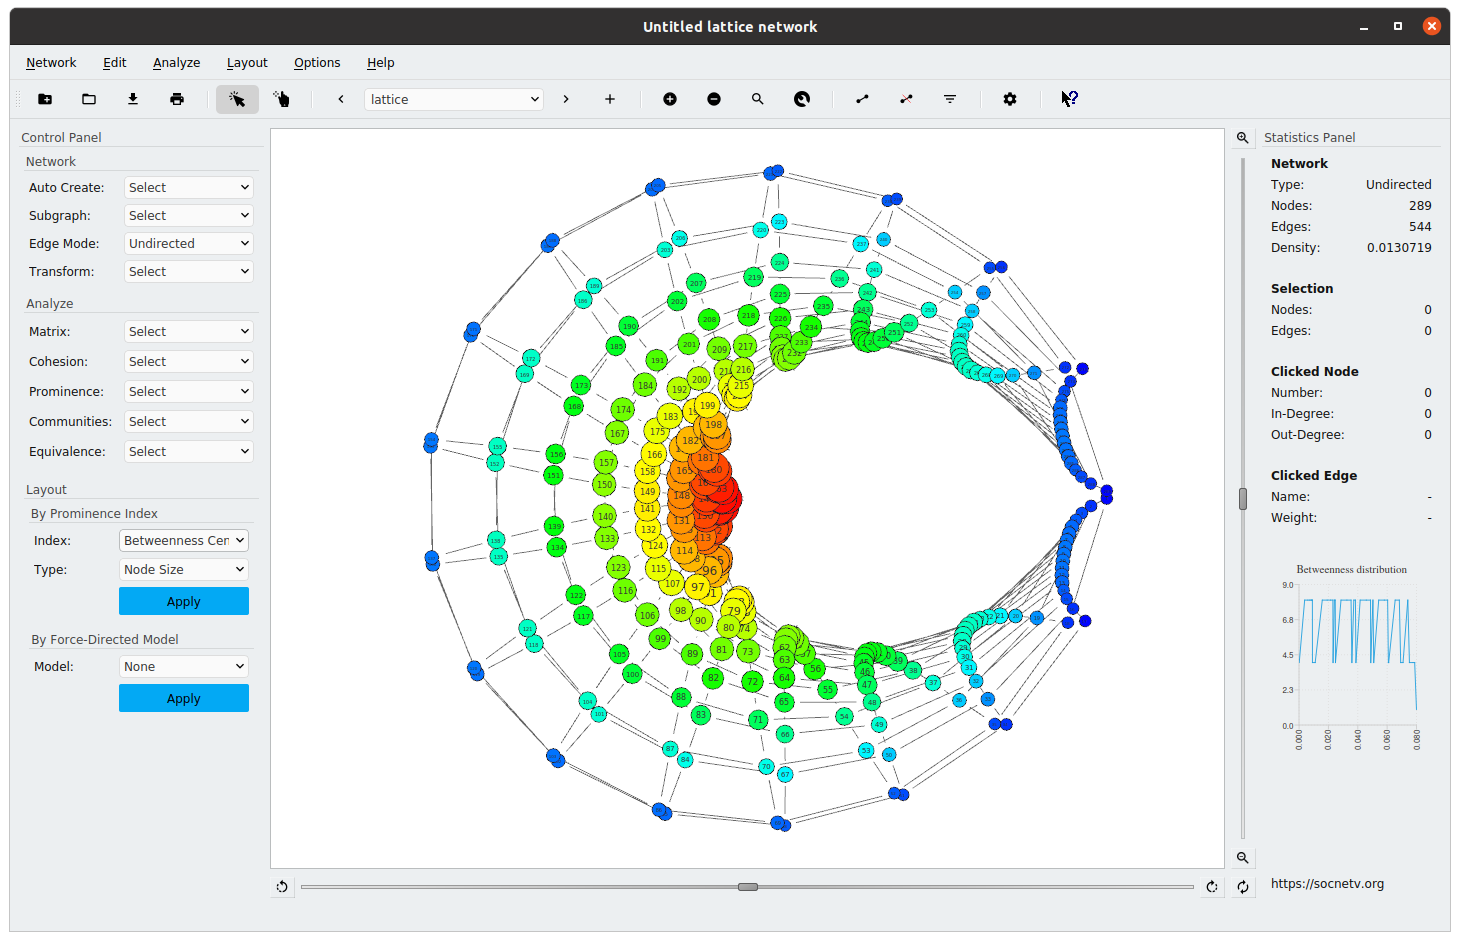
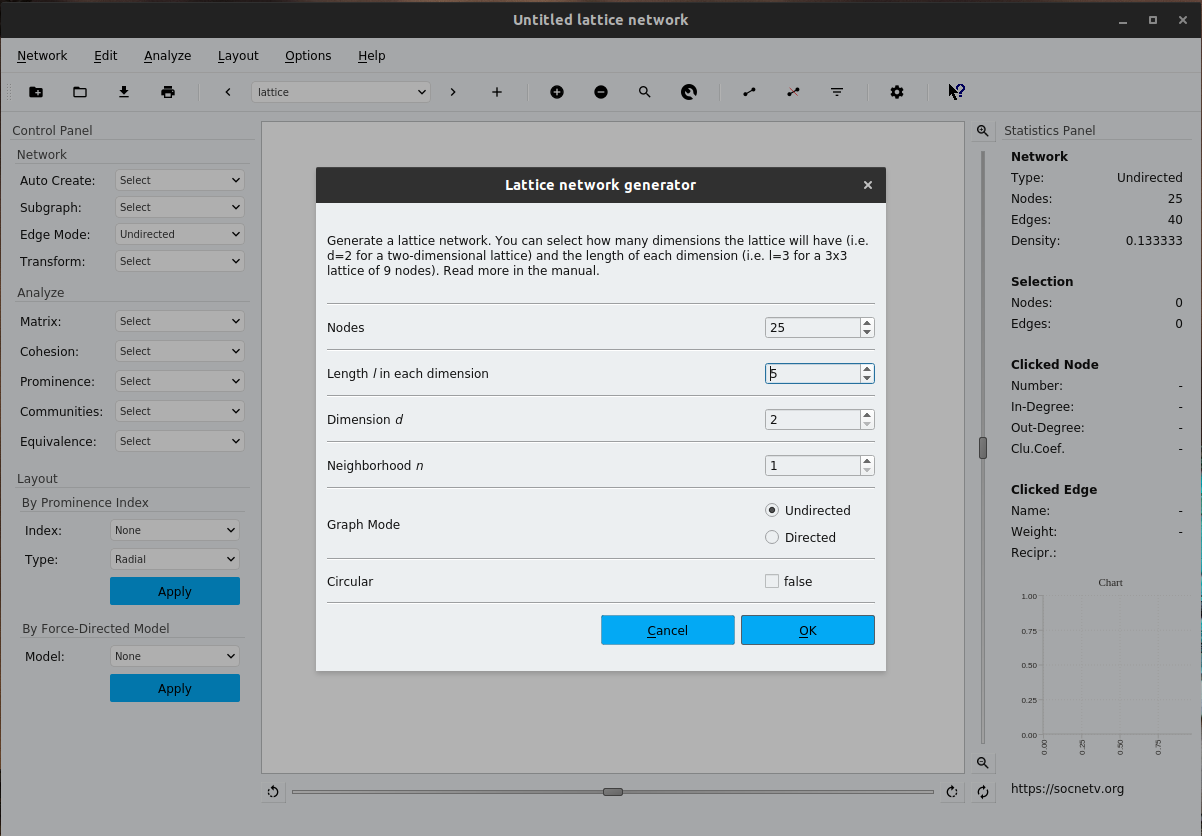
  • Lattice Network Generator: Create regular lattices of arbitrary dimensions. Define the lattice dimension d and the length/size l of each dimension. You can also define a custom neighborhood size n to set the distance within which neighbors on the lattice will be connected.

    Lattice Network Generator

  • Edge Dichotomization: For weighted networks, you can now dichotomize the edges according to a threshold. Edges with weights above the threshold will become binary, converting the network to a non-valued graph displayed in a new relation.

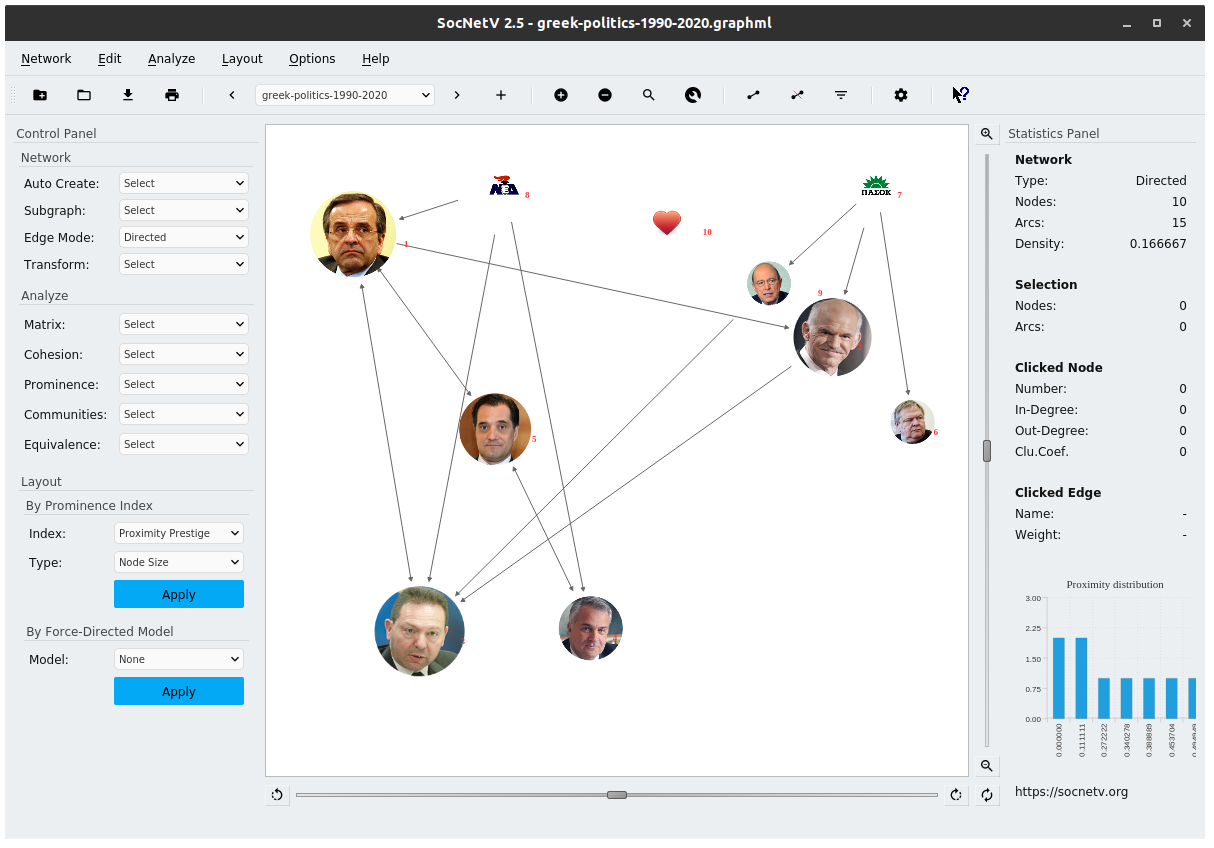
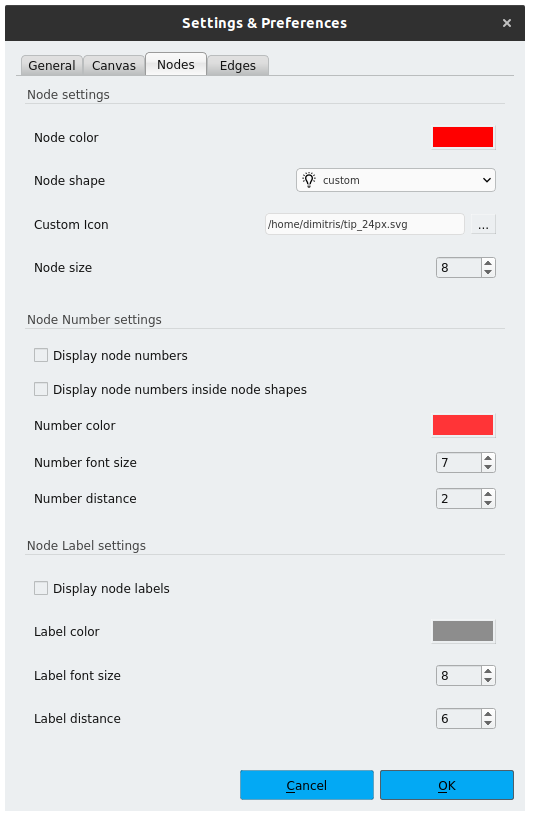
  • Custom Icons in Nodes: SocNetV now allows you to use custom images (e.g., PNG, JPEG, SVG) as node icons. You can choose the desired image from Settings -> Nodes. Any image file from your filesystem can be used as a custom node icon in your network.

    Custom Node Icons

    Additionally, SocNetV offers many built-in icons (e.g., person, computer, bug).

    Node Icons Settings

  • Export Network to Any Image Format: Export your network to any image format supported by Qt (e.g., PNG, JPG, BMP, TIFF).

  • Much Improved PDF Exporting: You can now select orientation, quality, and DPI when exporting the network to a PDF file.

  • Uniform UI Theme: A high-quality UI theme inspired by Material Design, providing a uniform look and feel across all operating systems.

  • New Control Panel Toolbox Menu: Network Auto Create: You can now automatically create a network with one click in the new toolbox menu. Random networks, famous datasets, and web crawlers are supported.

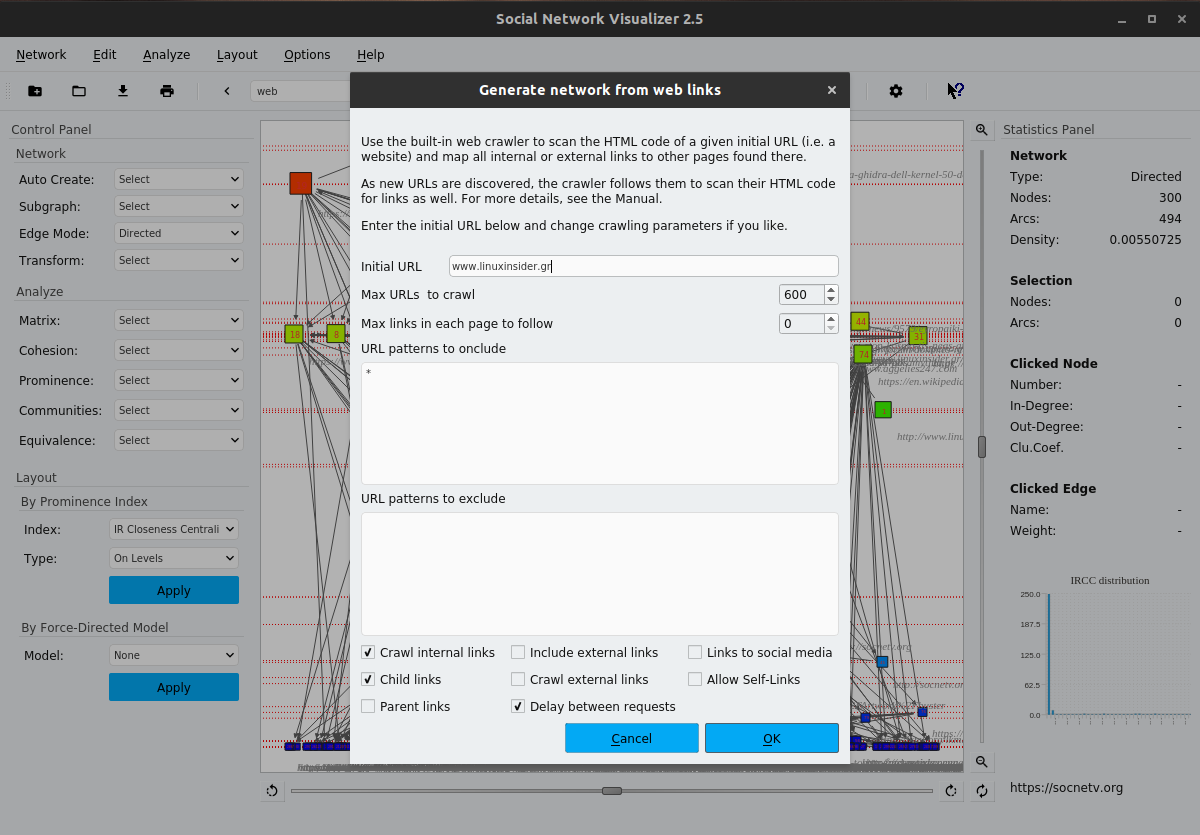
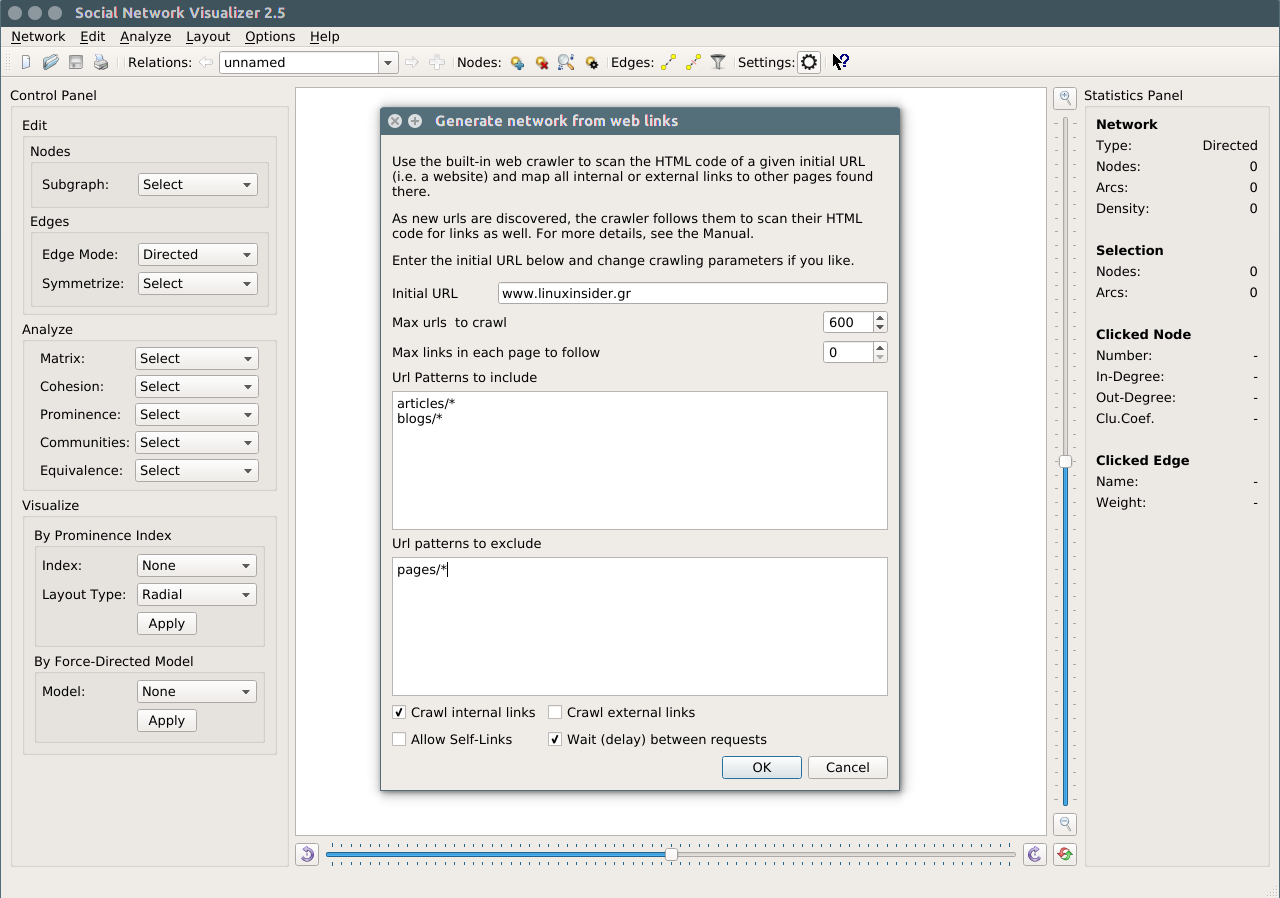
  • Improved Web Crawler: The built-in web crawler now runs faster and allows you to exclude/include social network links, parent, and child links.

    Web Crawler

  • Support for Floating Point Edge Weights: SocNetV now supports floating point (double) edge weights in Adjacency, GraphML, Pajek, edge lists, GML, etc. This fixes a bug with non-integer edge weights when importing Adjacency files.

    This version also brings speed optimization and improved memory management.

Availability

SocNetV v2.5 is now available for Windows, macOS, and Linux. Go to the SocNetV Downloads page to get it!

SocNetV 2.4 Released

SocNetV 2.4 Screenshot

Description

The Social Network Visualizer project released today a brand new version of our favorite social network analysis and visualization software application. SocNetV version 2.4, released on Feb 28, is a major upgrade bringing lots of new features. The new version is available for Windows, macOS, and Linux from the Downloads page.

New Features and Improvements

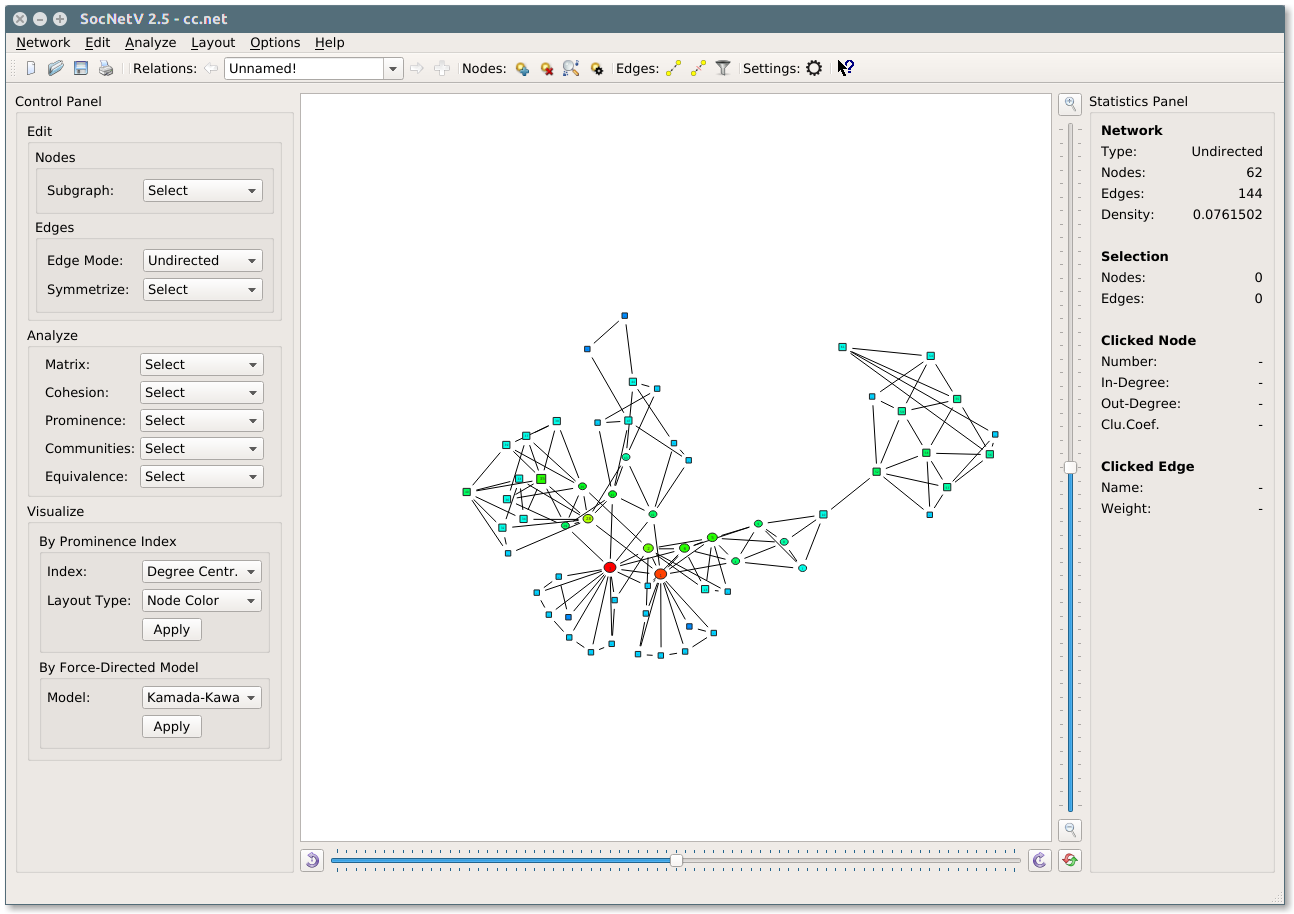
  • Kamada-Kawai Layout Model: This model treats the network as a dynamic system where actors are connected by “springs.” The layout optimizes the graph based on spring energy, minimizing the imbalance between desired and actual distances.

    Kamada-Kawai Layout

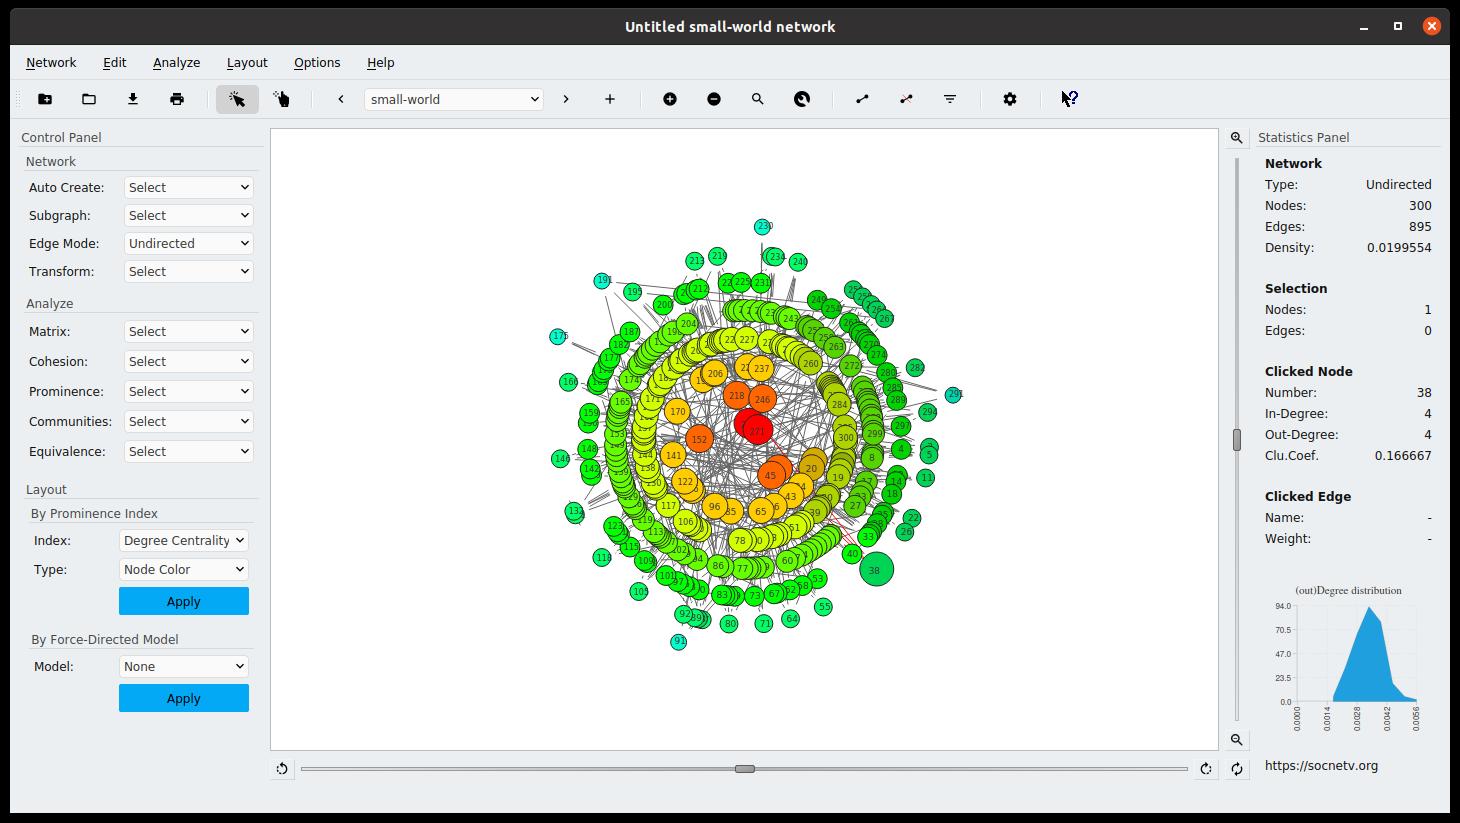
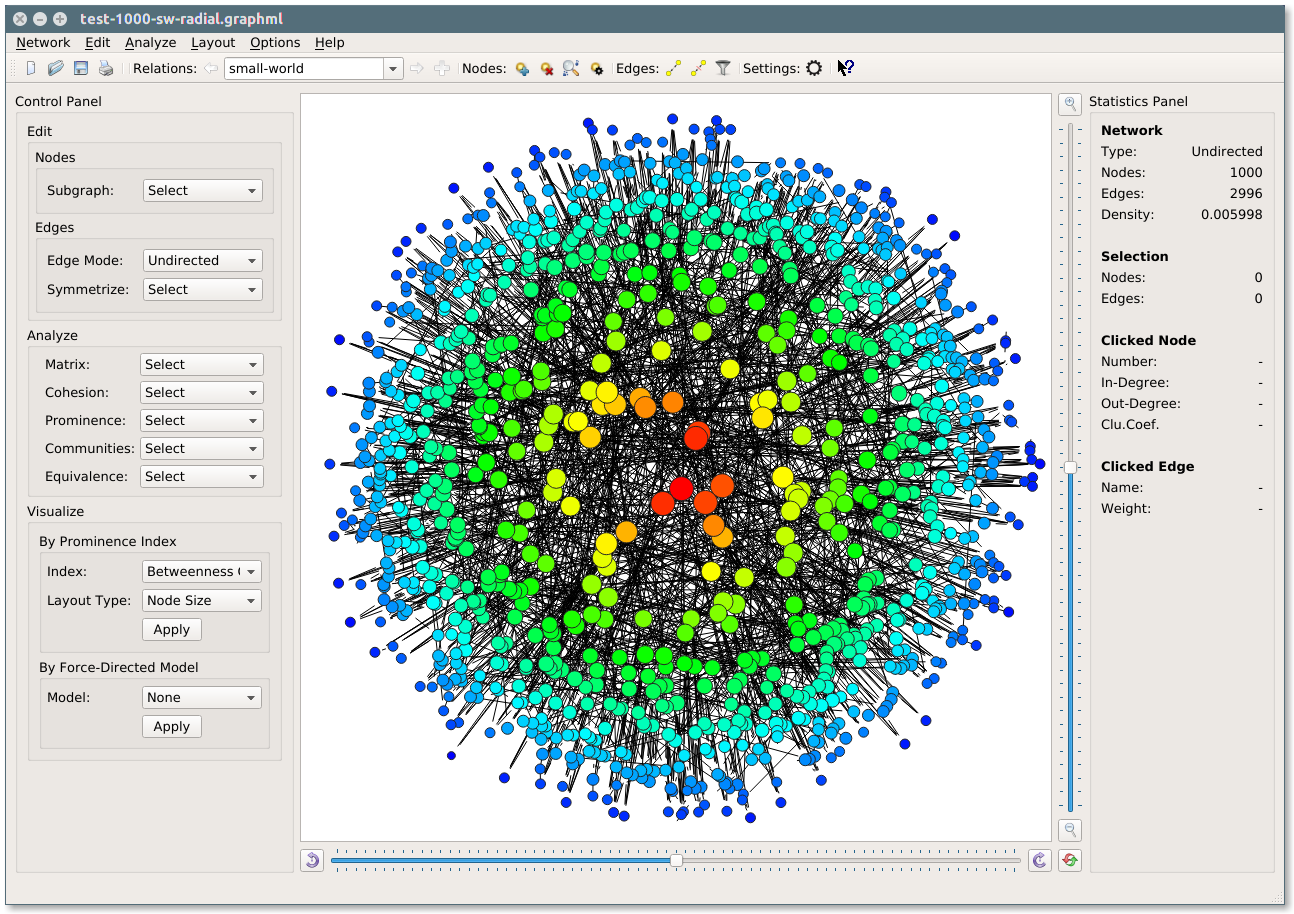
  • Node Colors by Prominence Score Visualization: In this version, SocNetV can visualize the prominence score of each actor by changing their color. The color reflects how important the actor is in the network, with red indicating high prominence and blue indicating lower prominence.

    Node Color by Prominence

  • Reciprocated Edges in Directed Networks: SocNetV now displays reciprocated edges in a single line with two arrows instead of two separate lines, reducing memory consumption and making the visualization more appealing.

    Reciprocated Edges

  • Improved Memory Consumption: The new version optimizes memory usage when loading large networks, improving performance for graphs with more than 2,000 edges.

  • Web Crawler Improvements: The web crawler dialog and algorithm have been enhanced with new options, including the ability to specify link patterns to include/exclude and control the delay between requests.

    Web Crawler

  • Improved Statistics Panel: The statistics panel now uses simpler text to display statistics more efficiently. It also shows edge direction weights for reciprocated edges in directed networks.

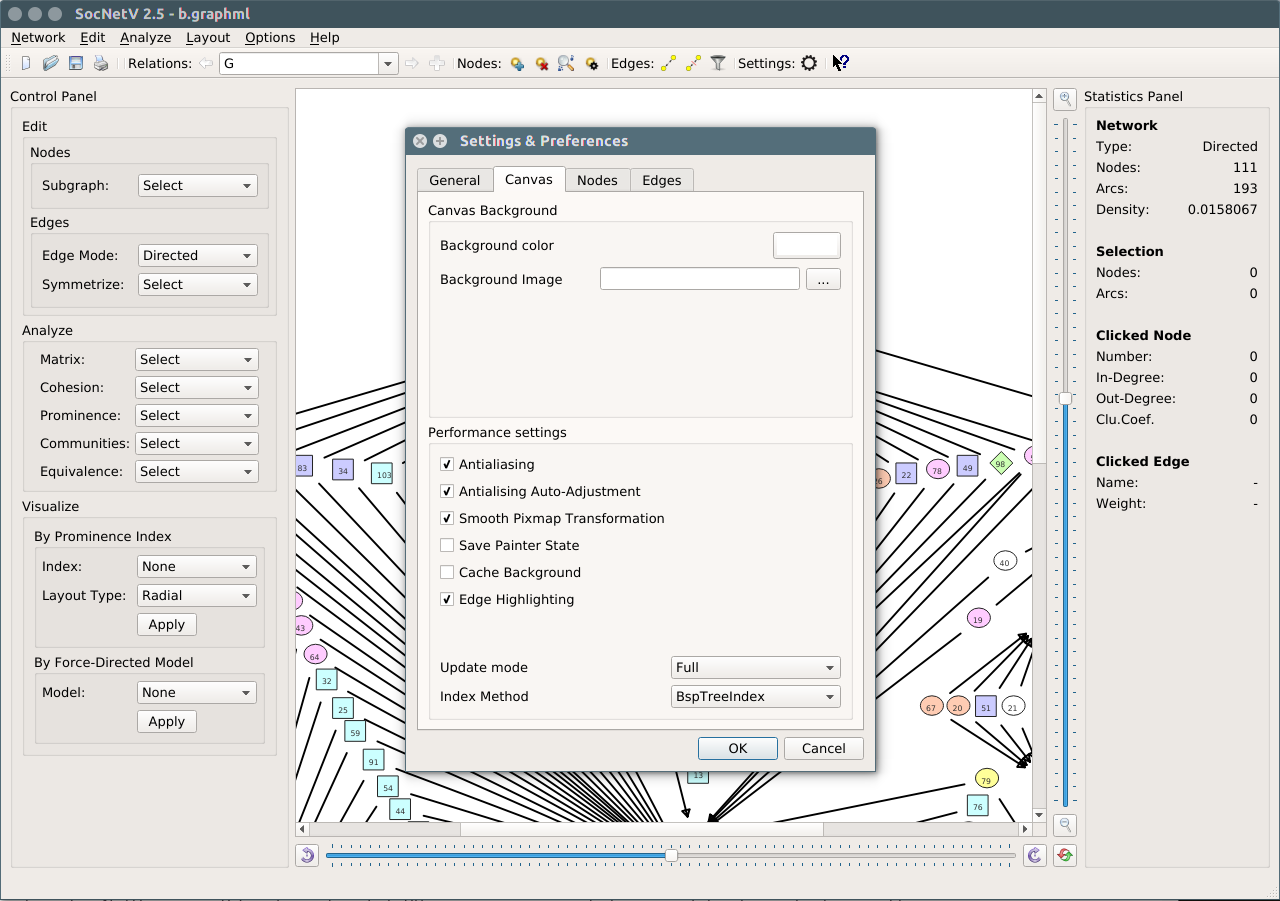
  • Performance Options in Settings: New performance options in the Settings dialog allow you to enable/disable features of the Qt GraphicsView, such as anti-aliasing and edge highlighting. Disabling certain options can significantly boost performance for large networks.

    Performance Options

  • Improved UCINET Format Support: SocNetV now supports reading two-mode UCINET files formatted in fullmatrix. These files declare both NR (nodes) and NC (columns) variables.

  • Improved Stability: Many bugs have been fixed, and random crashes were resolved. Below are some of the bugs that were fixed:

    • #40: Wrong BC scores in weighted networks
    • #54: Incorrect edge weight after user confirmation
    • #38: Disabling isolate nodes not reflected in distance matrix report
    • #41: Incorrect variance in clustering coefficient
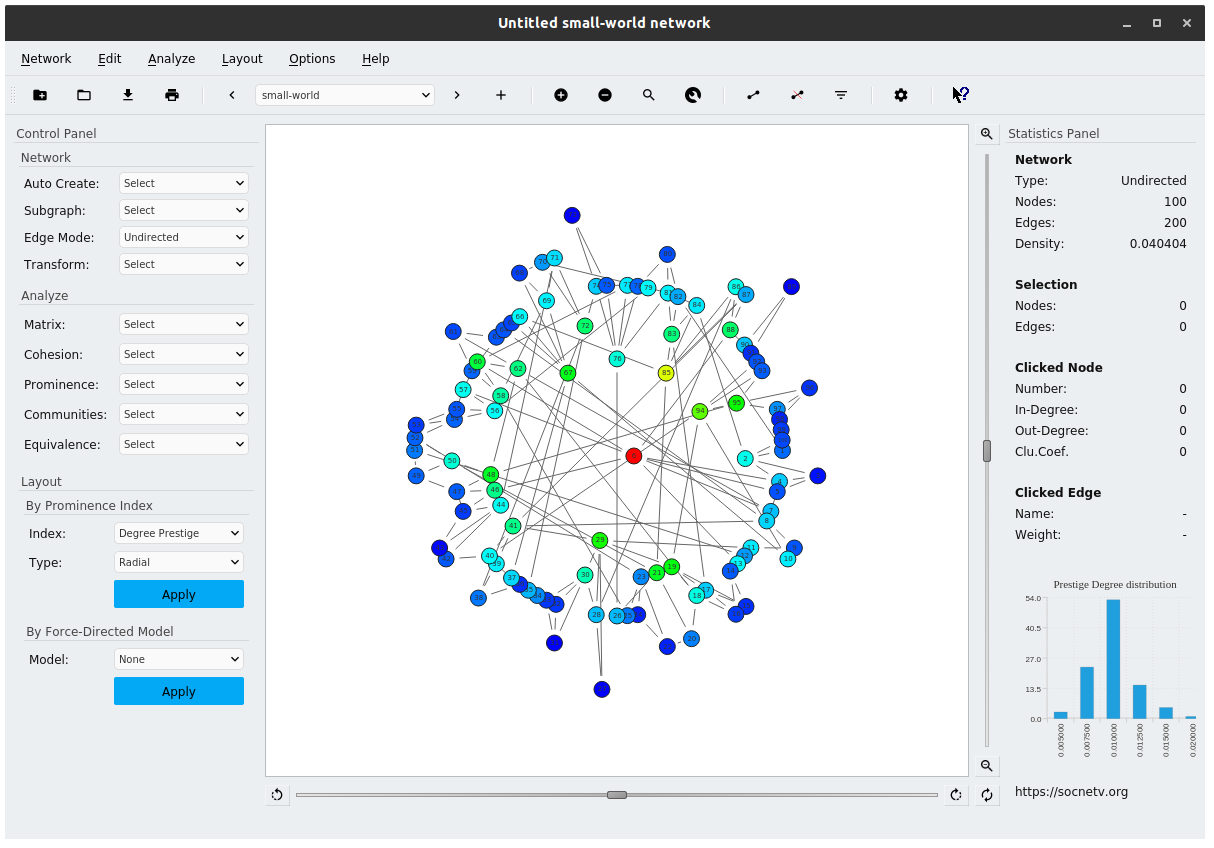
    • #33: Missing Radial/Level Layout by Eigenvector Centrality
    • #48: Eccentricity scores for isolated nodes
    • #34: No menu options for Node Size layout by Prominence index
    • #56: Edge offset issues when resizing nodes
    • #46: Crashes after disabling isolated nodes in distance matrix
    • #42: Improved progress dialogs
    • #44: Crash when searching after node removal
    • #51: Web crawler crashes fixed
    • #60: Incorrect file extension when saving famous datasets
    • #61: “Save As” issue with GraphML format
    • #62: EdgeList1 formatted UCINET files not recognized
    • #63: Two-mode UCINET files unsupported
    • #65: Crashes in HCA with ill-defined input matrices
    • #36: HCA crashes with isolated nodes
    • #49: Connectedness method issues
    • #47: Extra columns in adjacency matrix report

Availability

SocNetV v2.4 is now available for Windows, macOS, and Linux. Go to the SocNetV Downloads page to get it!

SocNetV 2.3 Released

The Social Network Visualizer project is happy to announce that a brand new version of our favorite social network analysis and visualization software application has been released. SocNetV version 2.3, released on Jul 5, has the eloquent codename “fixer” and it is now available for Windows, Mac OS X, and Linux from the Downloads page.

What the new version brings to the users?

As usual with our odd-numbered minor versions, this is a bugfix release. While v2.2 brought a lot of new and important features, v2.3 focuses on stability and fixing bugs here and there. Nevertheless, there are a couple of new features as well, which you may find interesting for your network analysis endeavors:

Dyad and Actor/Ego Reciprocity

Reciprocity, denoted by ‘r,’ is a network cohesion index. It measures the likelihood of vertices in a directed network to be mutually linked. SocNetV v2.3 supports two different methods to index the degree of reciprocity in a social network:

  • Arc reciprocity: The fraction of reciprocated ties over all actual ties in the network.
  • Dyad reciprocity: The fraction of actor pairs that have reciprocated ties over all pairs of actors that have any connection.

In a directed network:

  • Arc reciprocity measures the proportion of directed edges that are bidirectional. If the reciprocity is 1, the adjacency matrix is structurally symmetric.
  • Dyad reciprocity measures the proportion of connected actor dyads that have bidirectional ties between them.

In an undirected graph, all edges are reciprocal, and the reciprocity of the graph is always 1.

You can compute reciprocity on undirected, directed, and weighted graphs from the toolbox/menu: Analyze > Cohesion > Reciprocity. The report is opened and displayed as usual in HTML format in your preferred web browser.

Zero-weighted Edge Support

In ordinary SNA, zero-weighted edges are thought to be meaningless, but a user pointed out that SocNetV was accepting and drawing zero-valued edges when opening edge list formatted files. This behavior was due to a bug.

The concept of an edge in SNA (and SocNetV) is that two actors (i) and (j) are “connected” (and an edge is drawn between them) only if there is a non-zero value at sociomatrix cell (A(i,j)). Thus, if (A(i,j) = 0), the actors are considered not directly connected, and no edge should be drawn between them.

This assumption has implications for computations: all centrality and matrix manipulation algorithms of network analysis implicitly compute their results using only non-zero (and some only positive) weighted edges.

To accommodate users who may need this functionality for visualization purposes, we implemented support for zero-weighted edges in v2.3. This functionality currently works only for weighted edge lists and for simple visualizations.

Zero-weighted Edge Color Selection

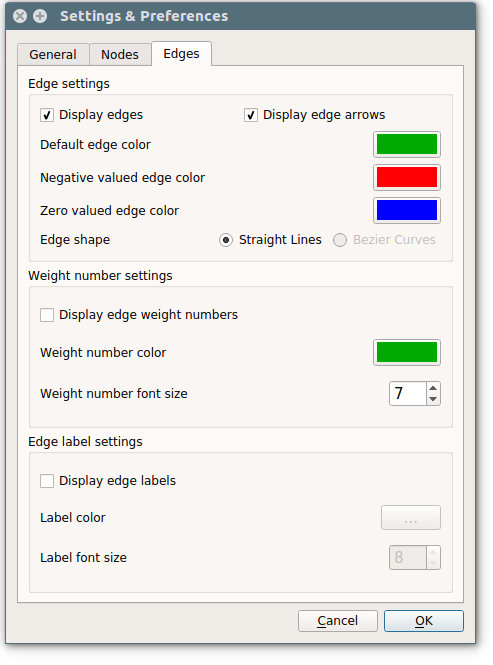
With the new feature above, the Settings dialog allows users to select a default edge color for zero-valued edges. Here is a screenshot:

SocNetV v2.3 Settings Dialog

SocNetV v2.2 Released with Cluster Analysis, Eigenvector Centrality, and More!

We are pleased to announce that a new version of your favorite social network analysis and visualization software application has been released. SocNetV version 2.2, codenamed “beyond”, brings many new features and is now available for Windows, Mac OS X, and Linux. Visit the Downloads page to get it!


What’s New in SocNetV v2.2?

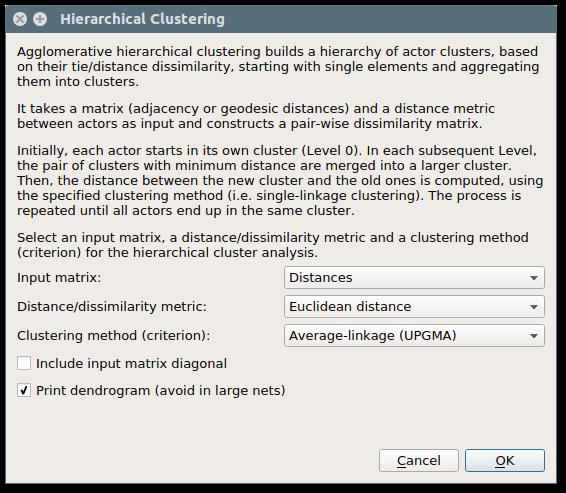
Hierarchical Clustering Analysis (HCA)

SocNetV now performs hierarchical agglomerative cluster analysis on social networks using these methods:

  • Single-Linkage (minimum)
  • Complete-Linkage (maximum)
  • Average-Linkage (UPGMA)

You can compute the Structural Equivalence matrix using adjacency or geodesic distance matrices with user-selected metrics such as Euclidean, Manhattan, and Jaccard distances.

HCA Dialog

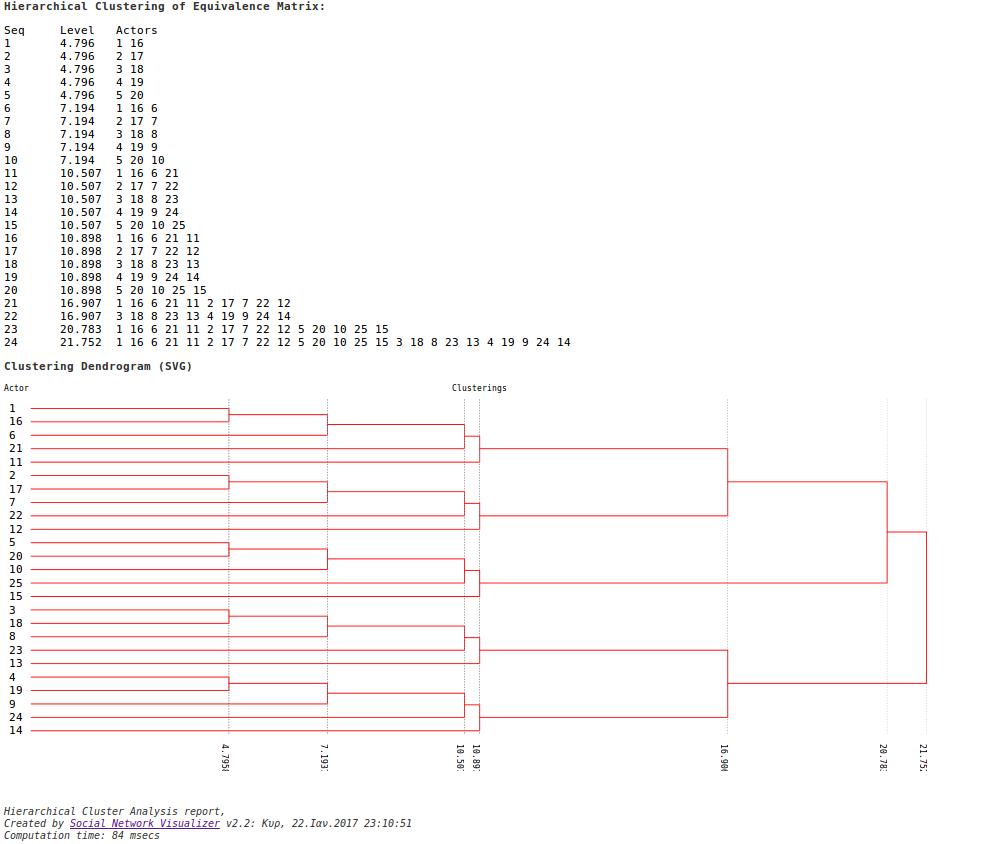
Results include:

  • A list of clusters per level.
  • A dendrogram of the cluster hierarchy in SVG format.

HCA Results


Eigenvector Centrality

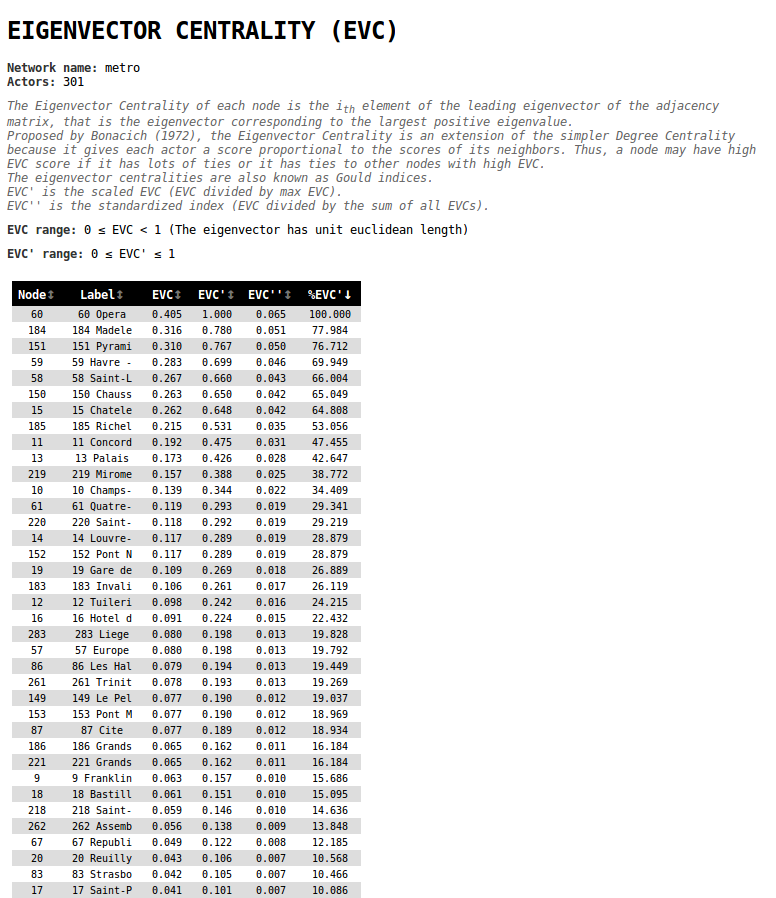
Version 2.2 introduces Eigenvector Centrality, which measures the influence of a node in a network based on the leading eigenvector of the adjacency matrix.

Eigenvector Centrality

Use this metric for network analysis or embedding radial/level layouts.

Eigenvector Layout


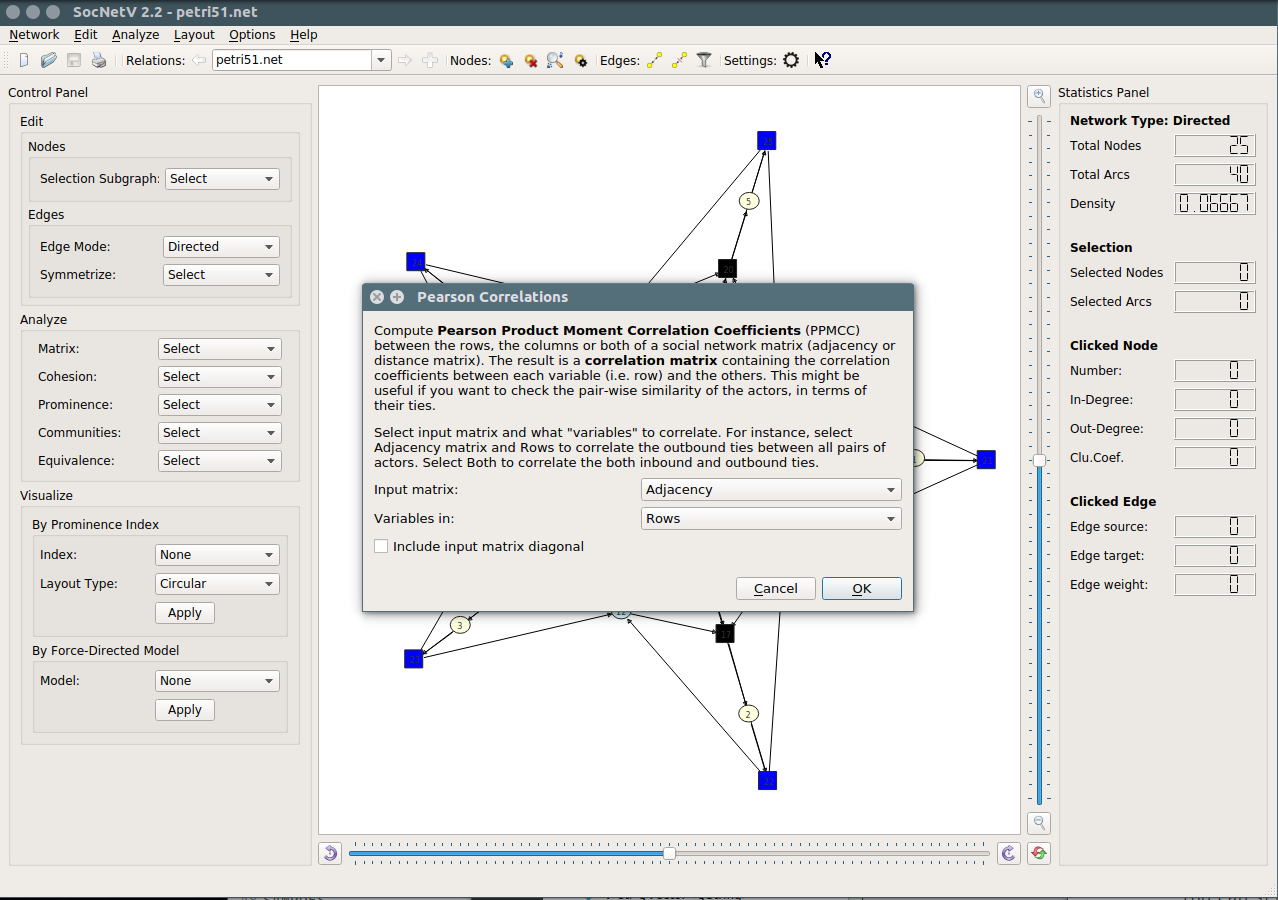
Pearson Product-Moment Correlation Coefficients

SocNetV now computes Pearson Correlation Coefficients to correlate actor profiles (ties or distances). Results are displayed as a correlation matrix.

Pearson Coefficients Dialog


Actor Similarity

Compare pairwise tie/distance profiles of actors to produce a similarity matrix using measures like:

  • Simple Matching
  • Jaccard
  • Hamming
  • Cosine Similarity
  • Euclidean Distance

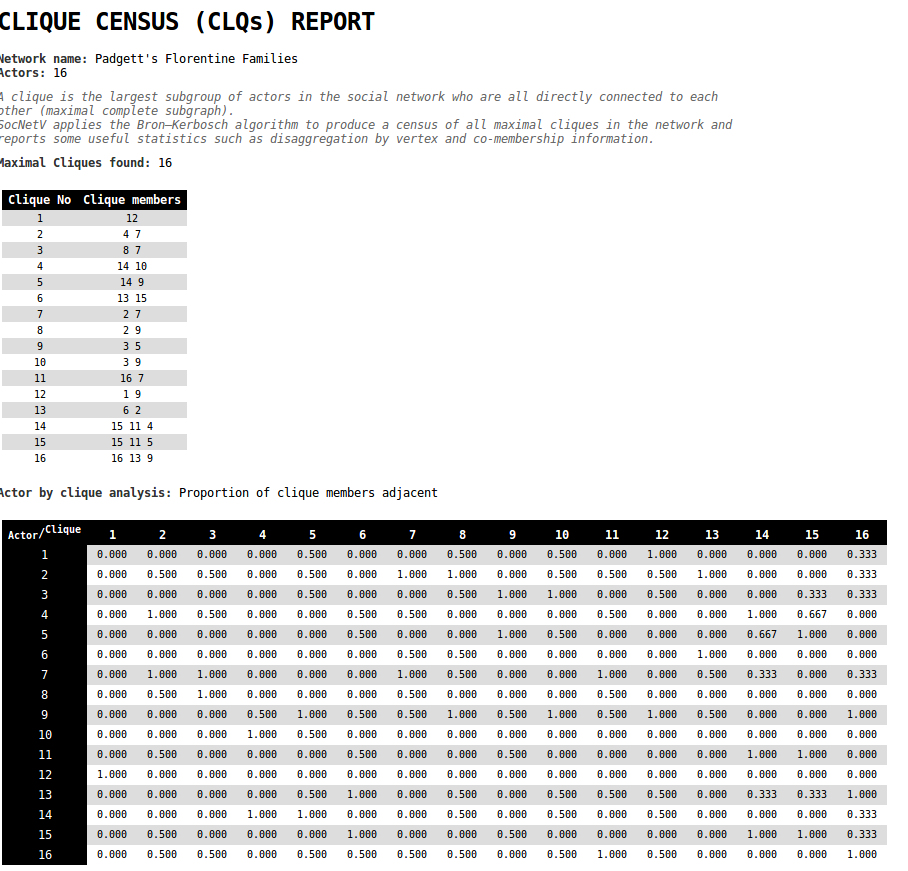
Maximal Clique Census

Using the Bron–Kerbosch algorithm, SocNetV finds all maximal cliques in undirected or directed graphs. The clique census report includes useful statistics, co-membership information, and dendrograms.

Clique Census Report


Additional Features

Cocitation Analysis

  • Compute Cocitation Matrices.
  • Create Cocitation Networks, where actors are connected if they are cited by common neighbors.

Symmetrize Edges by Strong Ties

Create new relations using only strong, reciprocal ties.

Multi-relational GraphML Support

Read and write .graphml files with multiple relations.

GML and Pajek Support

Support for GML formatted data and multi-relational Pajek files.


Performance Improvements

  • Faster matrix multiplication using optimized algorithms.
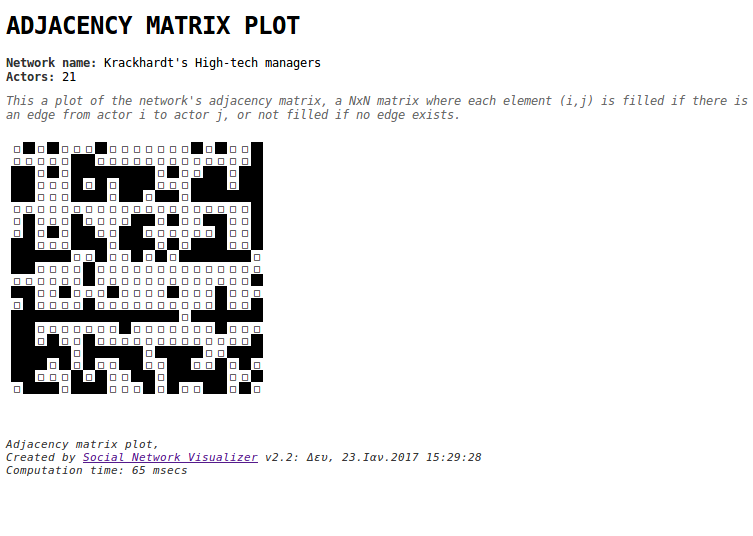
  • Enhanced adjacency matrix plotting with Unicode characters.

Adjacency Matrix Plot


Bug Fixes and Notices

  • Resolved various issues like incorrect distances in weighted networks, edge labels not saving, and more.
  • New dataset: Petersen Graph.
  • Transformed Krackhardt’s High-tech Managers and Zachary Karate Club into multirelational datasets.

Important Notices:


Download SocNetV v2.2 today and enjoy the new features and improvements!

SocNetV v2.1 Released!

Today is a wonderful day because we are happy to announce that a brand-new version of our favorite social network analysis and visualization software application has been released. SocNetV version 2.1, released on September 28, 2016, has the codename “fixer” and is available for Windows, Mac OS X, and Linux from the Downloads page.


What’s New in SocNetV v2.1?

Faster and More Accurate Network Analysis Computation

  • Improved algorithms for social network analysis allow most metrics to be computed simultaneously. The results are saved and reused during the session, recalculating only when nodes, edges, or weights are modified.
  • Fixed metrics like PageRank Prestige (PRP) and Average Graph Distance (AGD) now produce accurate results.

New d-Regular Random Network Generator

  • The d-regular network generator has been rewritten and now generates both directed and undirected d-regular random networks without errors.

Improved UCINET Format Support

  • Fullmatrix format is now supported again. SocNetV already supports the edgelist format, ensuring compatibility with more datasets.

Better Network Visualization

  • Fixed issues with node and edge stacking on the canvas.
  • Corrected the display of edges with large weights to prevent overly thick lines.

Bug Fixes

  • #1624561: Network files with both arcs and edges are loaded as solely undirected nets.
  • #1622889: The d-regular generator does not produce random networks.
  • #1623812: After loading a new network file, the app behaves as if the network has changed.
  • #1624583: UCINET .dl files crash the app.
  • #1624750: Random new nodes can be drawn out of the canvas.
  • #1625831: Removing an edge in undirected graphs does not update the node outDegree.
  • #1627390: Wrong PageRank Prestige results in undirected nets.
  • #1627721: Incorrect average graph distance metric in disconnected networks.
  • #1628382: Edges with very large weights are drawn with huge line widths.
  • #1627213: Crashes when double-clicking on a target node after deleting the source node.
  • #1628170: Edge labeling with HTML special characters breaks GraphML files.
  • #1622891: Highlighted edges should have a larger z-index.
  • #1624352: The “Change Edge Color” dialog does not display the current edge color.
  • #1624360: Default edge color and node shape are incorrect in Edit menu dialogs.
  • #1628395: Incorrect z-value of nodes and edges caused cluttering.

Download SocNetV v2.1 today and, as always, have fun with your social network analysis projects!

SocNetV 1.2 Released with New GUI and Features

SocNetV version 1.2 has been released! This update brings a major GUI overhaul, new prominence measures, advanced visualization layouts, and numerous bug fixes.


Highlights

Redesigned Conceptualization of Prominence

SocNetV now distinguishes between Centrality indices and Prestige indices, following frameworks by Wasserman & Faust and Knoke & Burt:

  • Centrality Indices (for undirected graphs or outLinks in digraphs):

    • Degree Centrality (DC)
    • Closeness Centrality (CC)
    • Influence Range Closeness Centrality (IRCC)
    • Betweeness Centrality (BC)
    • Stress Centrality (SC)
    • Eccentricity Centrality (EC)
    • Power Centrality (PC)
    • Information Centrality (IC)
  • Prestige Indices (for directed graphs, focusing on inLinks):

    • Degree Prestige (DP)
    • Proximity Prestige (PP)

SocNetV 1.1 Released

SocNetV version 1.1 has just been released! This version focuses on fixing numerous bugs identified since version 1.0.


Highlights

This release is a bugfix update, improving stability and functionality. For a complete list of fixes, refer to the ChangeLog.


Downloads

Source code, binaries for Windows, Fedora, and openSUSE, as well as a Mac OS X 10.9 disk image, are available on the Downloads page.


Enjoy the improved stability and performance of SocNetV 1.1!

SocNetV 1.0 Released

SocNetV version 1.0 has just been released! This milestone marks the first version built on the new Qt5 toolkit, introducing exciting features and improvements.


Highlights

  • PageRank Calculation and Layout: Analyze networks using the popular PageRank algorithm.
  • Bug Fixes: Enhanced stability and performance.

Downloads

Source code is available on the Downloads page.


Experience the enhanced features and performance of SocNetV 1.0!